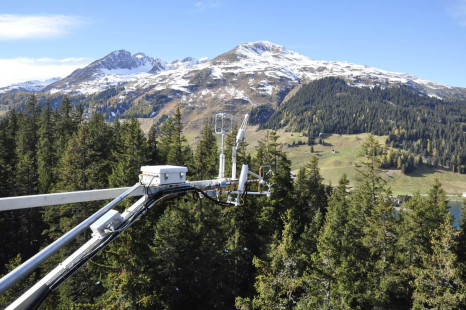
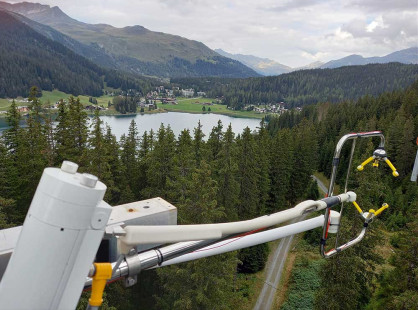
CH-DAV, Davos
Contents
Site Description
- ICOS Class 1 ecosystem station since Nov 2019
- Part of ICOS Switzerland
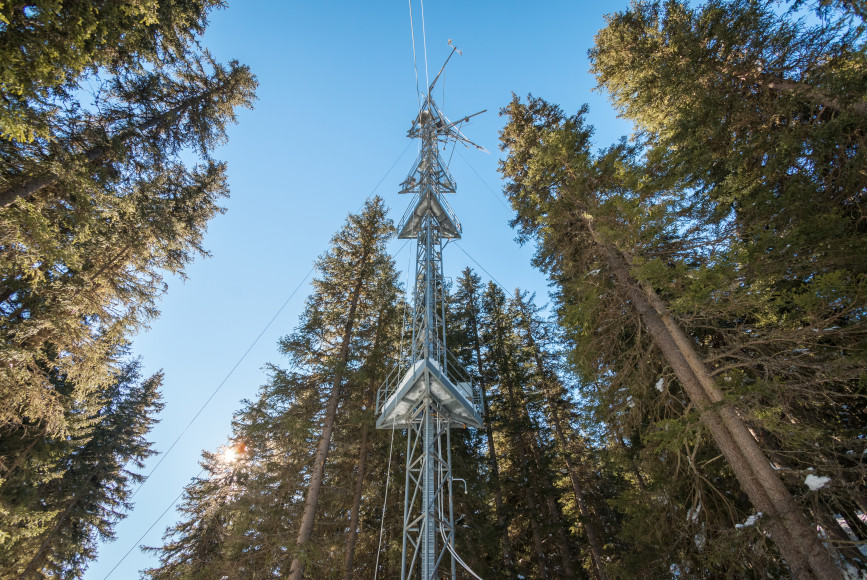
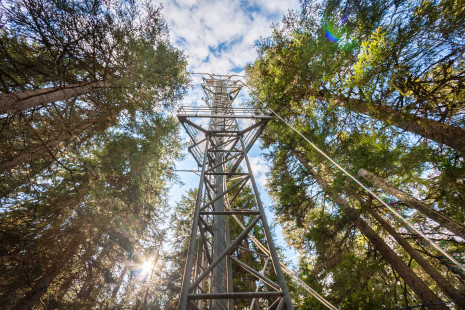
The Davos station received the status of an ICOS Class 1 Station in November 2019. It provides the 8th longest time series for CO2 and H2O vapour fluxes globally (since 1997, read more in the station history) and is the only subalpine Class 1 forest Ecosystem station within ICOS. The coniferous forest is located at 1639 m a.s.l. and mainly consists of Norway spruce (Picea abies (L.) Karst.). Trees are on average 17.5 m high, while the tallest trees reach 41 m. The average tree age is 119 years, the oldest tree is estimated to be 350 years old. For the average values, measurements of the ICOS CP and SP plots were weighted by the respective flux contributions (find more details in the published site description). Leaf area index is about 4 m2 m-2. The understorey vegetation is rather patchy, covering roughly 30% of the forest floor, and is mainly composed of dwarf shrubs, primarily Vaccinium myrtillus L. as well as mosses. Davos is part of Swiss FluxNet.
The long continuous track record of measurements makes this research site a predestined location for investigations about (missing) links between climate change and tree physiological adaptations and to a hot spot for addressing questions about the ecosystem carbon balance in relation to soil related components and tree physiological processes under changing environmental conditions.
Measurements at the Davos station are jointly organized by ETH Zurich, Swiss Federal Institute for Forest, Snow and Landscape Research (WSL) and Swiss Federal Laboratories for Materials Science and Technology (Empa) / National Air Pollution Monitoring Network (NABEL). The infrastructure is provided by the Federal Office of Environment (FOEN). Past and ongoing projects cover topics from soil, vegetation, ecosystem to atmosphere.
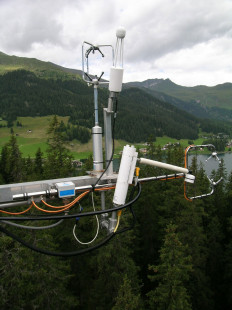
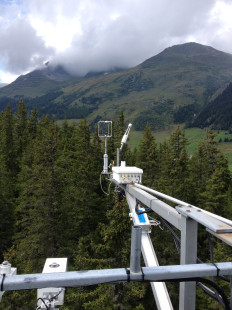
The ICOS relevant measurement programme at Davos is organised as follows:
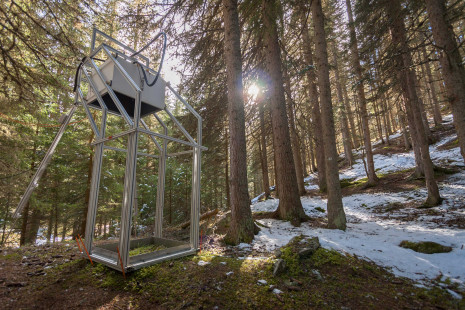
- Greenhouse gas measurements (CO2, H2O, CH4 and N2O) using the eddy covariance technique and custom-made automated soil chambers, soil meteorology (ETH Zurich)
- Meteorology (Empa)
- Measurements of tree growth, stem CO2 exchange as well as leaf area index, biomass, N losses etc. (WSL)
At the Ecosystem Thematic Centre, the full list of variables measured at an ICOS Class 1 forest station is shown.
- Site history
- Detailed site description: Collection of files with information about Seehornwald Davos CH-DAV
- Projects: a list of past and ongoing projects can be found here: Past and ongoing projects at Davos Station
- Tower sharing: Additional info about the tower and tower sharing: Tower Sharing (CH-DAV)
- Map (2018)
Location
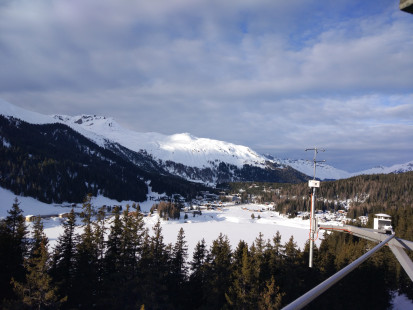
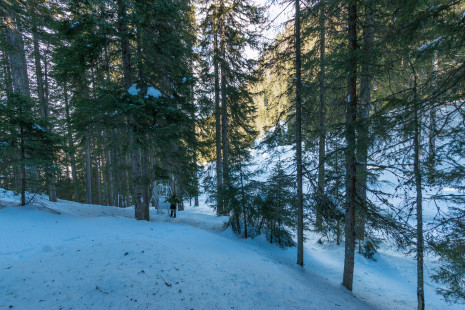
The Seehornwald Davos research site is located in the middle range of the subalpine belt in the eastern part of the Swiss Alps.
- Altitude: 1639 m a.s.l.
- Altitudinal zone: subalpine
- Country: Switzerland (Canton Graubünden)
- Coordinates: 46°48’55.2″N / 9°51’21.5″E (46.815333, 9.855972) (Google Maps)
- FLUXNET identifier: CH-Dav
Climate
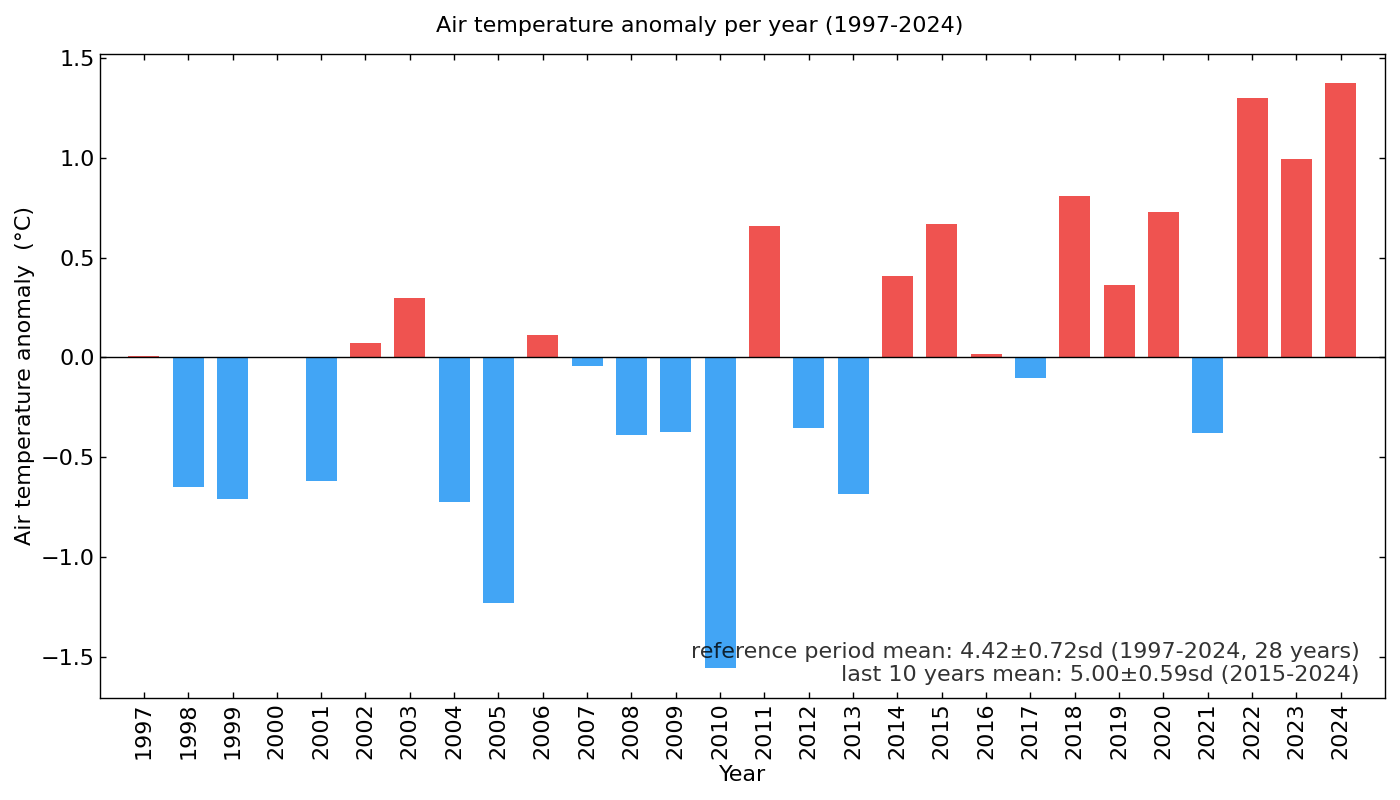
Air Temperature (1997-2024)
- Mean annual air temperature: 4.42°C
- 5 warmest years: 2024 (5.79°C), 2022 (5.72°C), 2023 (5.42°C), 2018 (5.23°C), 2020 (5.15°C)
- 5 coolest years*: 2010 (2.86°C), 2005 (3.19°C), 2004 (3.69°C), 1999 (3.71°C), 2013 (3.74°C)
- Lowest number of half-hours < 0°C: 2024 (4153), 2014 (4256), 2011 (4272), 2022 (4473), 2015 (4490)
- Highest number of half-hours > 20°C: 2003 (687), 2023 (664), 2015 (614), 2022 (584), 2024 (548)
- Highest number of half-hours > 25°C: 2019 (98), 2023 (65), 2015 (55), 2013 (53), 2012 (32)
- Highest measured air temperature: 28.7°C (26 Jun 2019, half-hourly average between 14:00 and 14:30)
- Lowest measured air temperature: -25.0°C (4 Feb 2012, half-hourly average between 8:30 and 9:00)
Precipitation
- Mean annual precipitation: 880 mm (1997-2024)
Nearby meteo stations
- Meteoswiss: Davos (Google Maps) Data since: 1 Jan 1864 | 1594 m a.s.l. | in 1 km distance
- Meteoswiss: Klosters (Google Maps) Data since: 1 Jan 1864 | 1186 m a.s.l. | in 5 km distance
Vegetation
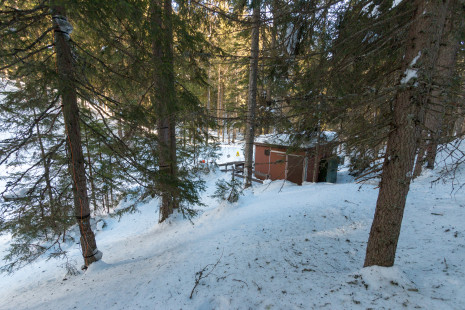
- The coniferous forest is dominated by Norway spruce (Picea abies (L.) Karst.)
- Trees are on average 17.5 m high, while the tallest trees reach 41 m. The average tree age is 119 years, the oldest tree is estimated to be 350 years old.
- Leaf area index (LAI): approx. 4 m2 m-2
- The understorey vegetation is rather patchy, covering roughly 30% of the forest floor, and is mainly composed of dwarf shrubs, primarily Vaccinium myrtillus and Vaccinium gaulterioides as well as mosses.
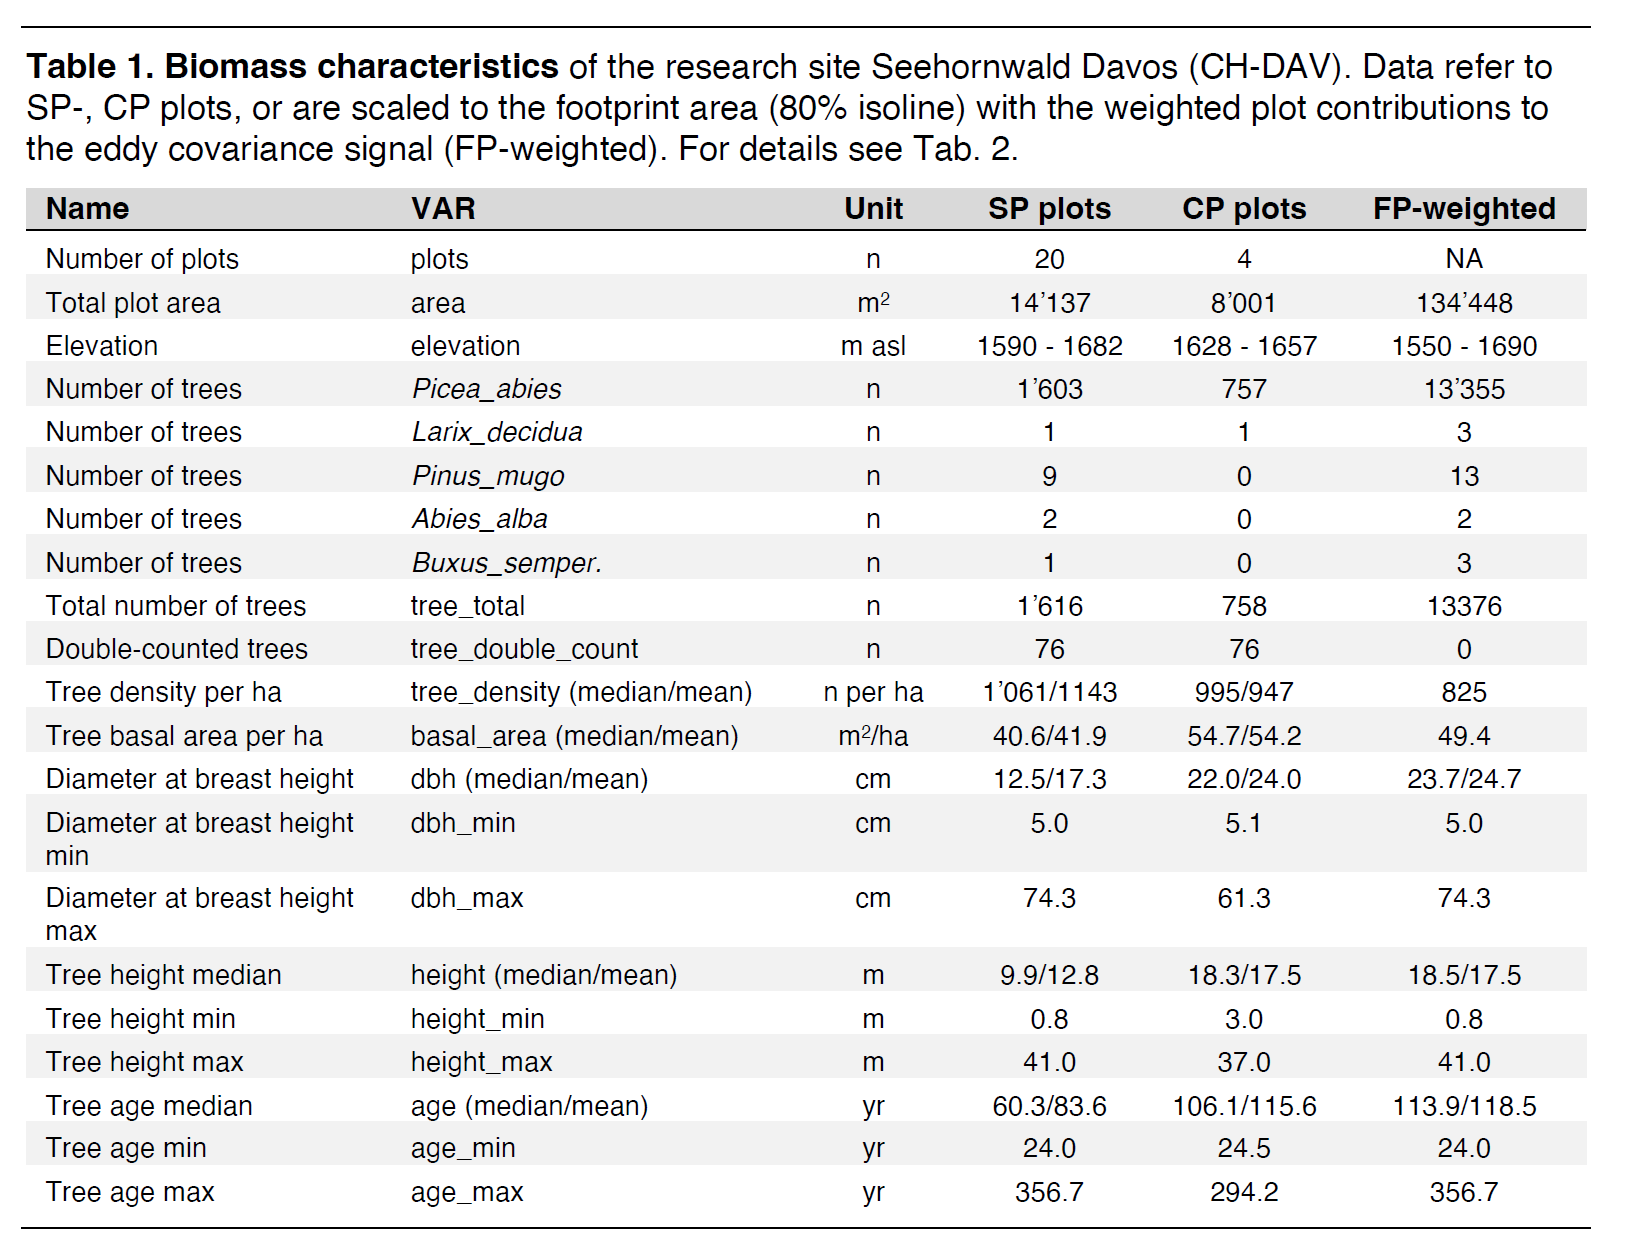 Table 1. Biomass characteristics of the research site Seehornwald Davos (CH-DAV). Data refer to SP-, CP plots, or are scaled to the footprint area (80% isoline) with the weighted plot contributions to the eddy covariance signal (FP-weighted). For details see Tab. 2. |
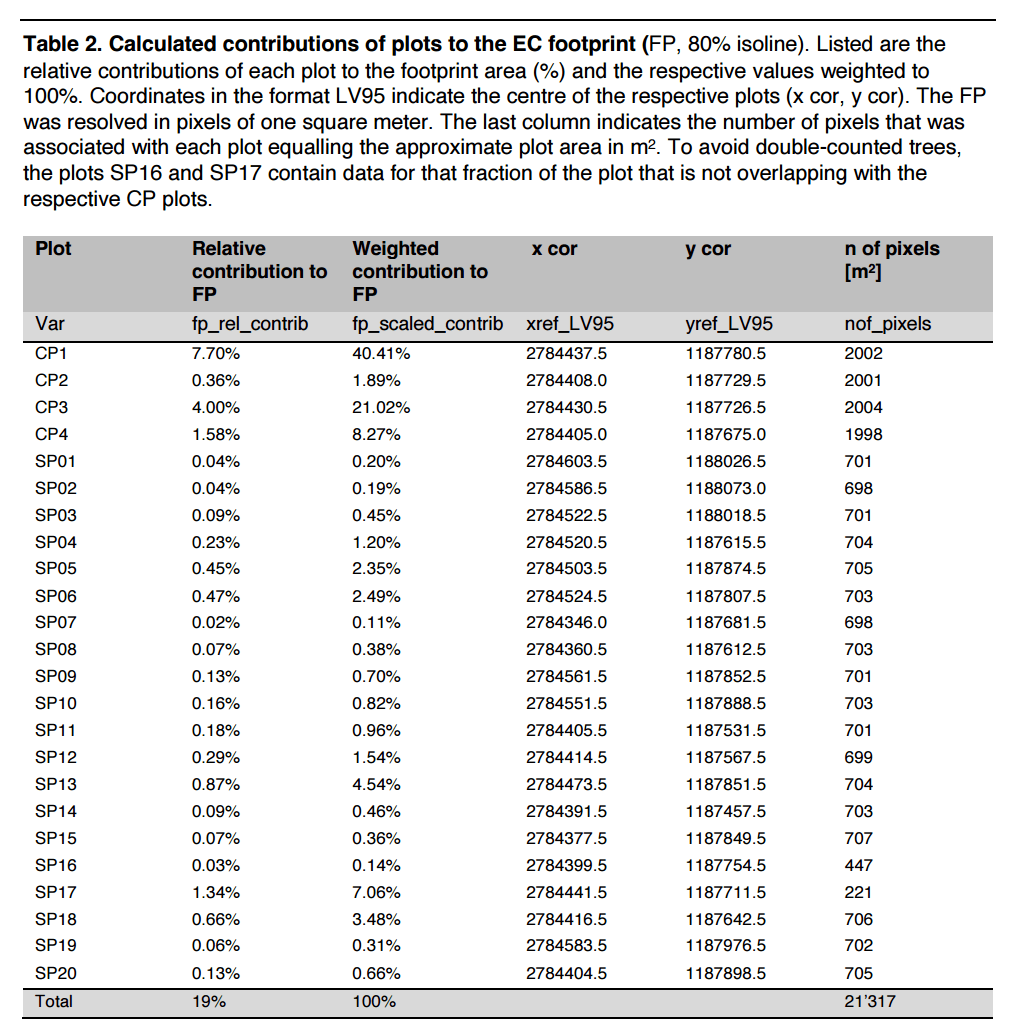 Table 2. Calculated contributions of plots to the EC footprint (FP, 80% isoline). Listed are the relative contributions of each plot to the footprint area (%) and the respective values weighted to 100%. Coordinates in the format LV95 indicate the centre of the respective plots (x cor, y cor). The FP was resolved in pixels of one square meter. The last column indicates the number of pixels that was associated with each plot equalling the approximate plot area in m2. To avoid double-counted trees, the plots SP16 and SP17 contain data for that fraction of the plot that is not overlapping with the respective CP plots. |
Soil
- Analysis from ICOS: CH-DavCarbonReportv2_ICOS_20231025.pdf (700KB)
Management
- Management system: high forest
- Silvicultural system: group selection
- Current land use includes little thinning activities. In 2006, an area of 25 x 70 m (1750 m2) within the NE-part of the footprint of the EC site was harvested at the end of October.
Data
Current Flux Products
Available Level-1 Fluxes
- For info about the different flux levels, see Flux Processing Chain
Eddy covariance raw data files
- Overview of eddy covariance raw data files since 1997: EC Raw Binary Format (CH-DAV)
Additional data information
- Dataflow flowchart (2018)
- Timing of ICOS Dataflow
- Example dataflow (2018): Datalogger: CR1000
- Files Generated On-Site
- Variables Logged On-Site (2021)
- Near-realtime data for this station can be downloaded from the ICOS Carbon Portal
- At the Ecosystem Thematic Centre, the full list of variables measured at an ICOS Class 1 forest station is shown.
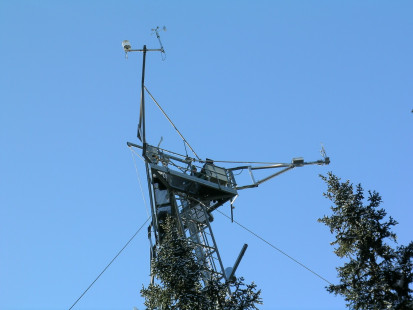
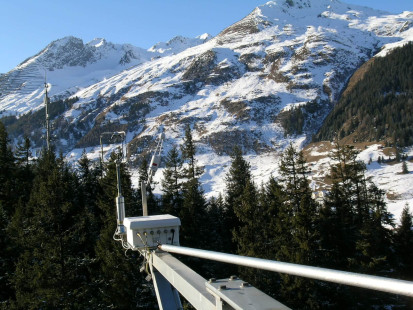
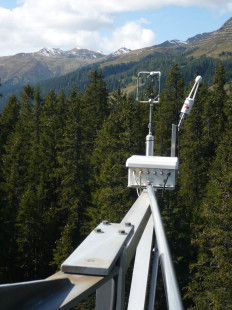
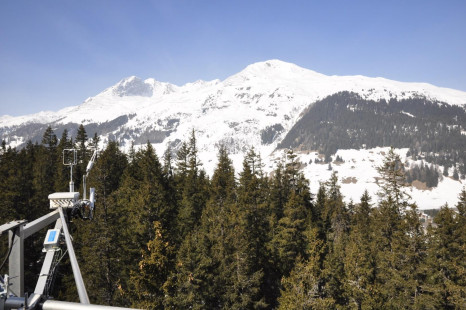
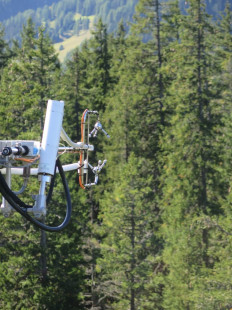
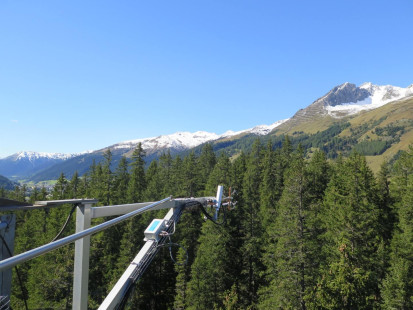
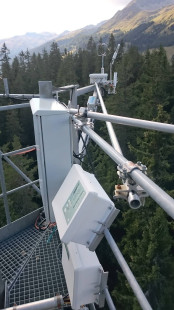
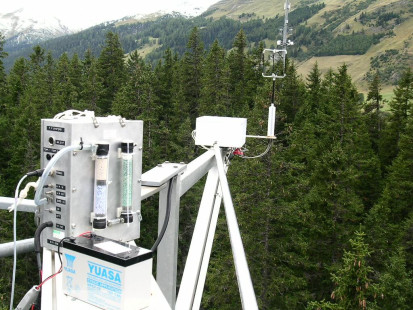
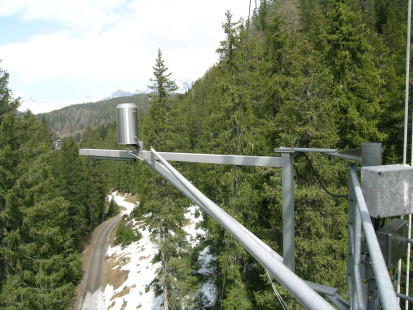
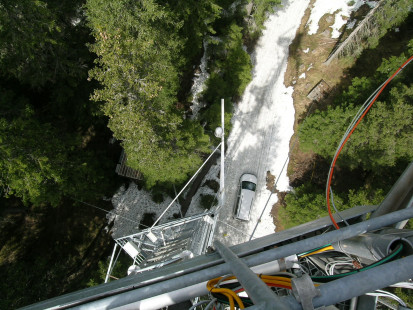
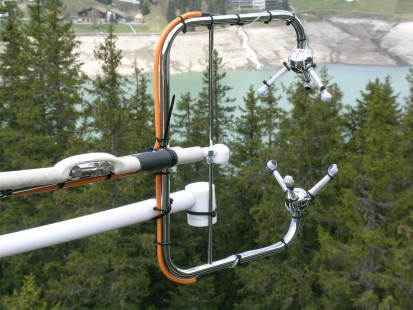
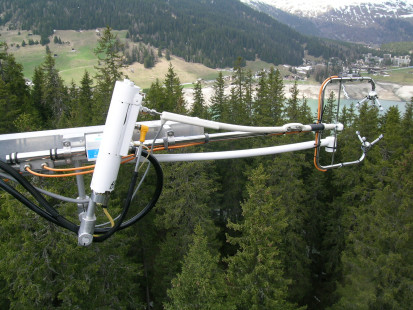
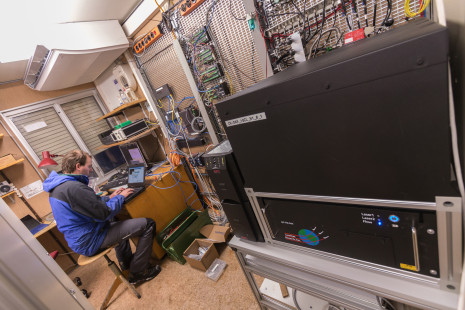
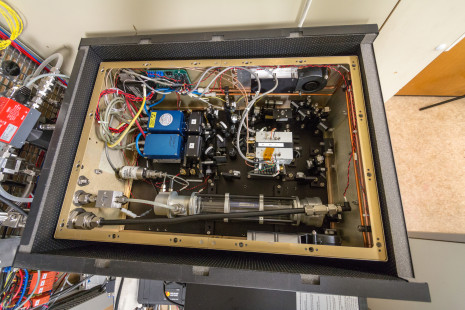
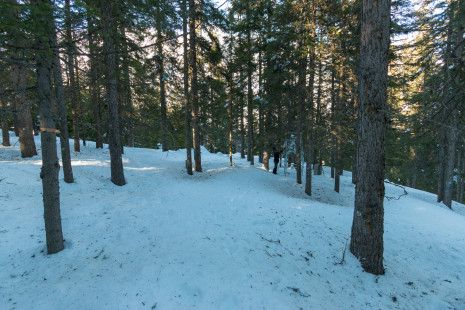
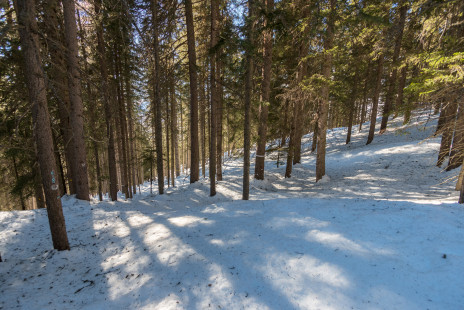
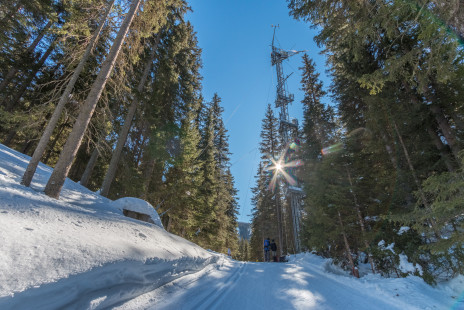
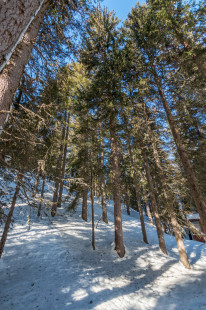
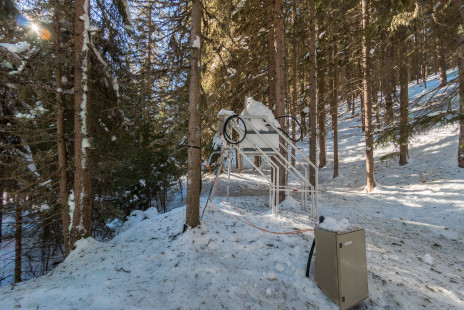
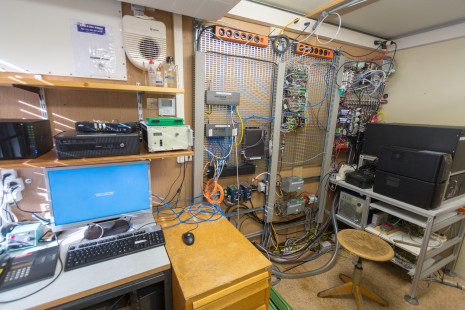
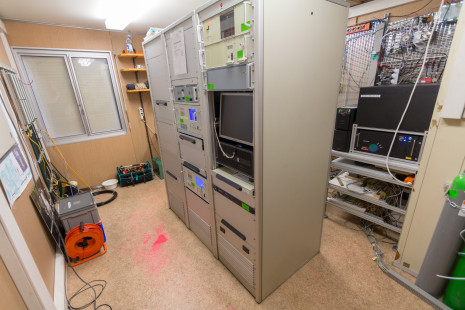
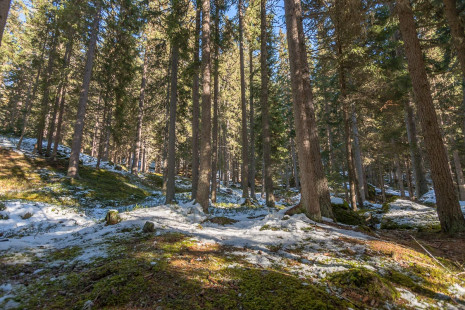
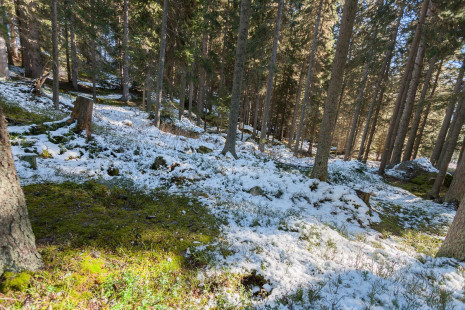
Photos

Video
25 years of CO2 flux measurements in Davos (2022)
More videos can be found on Videos (CH-DAV).
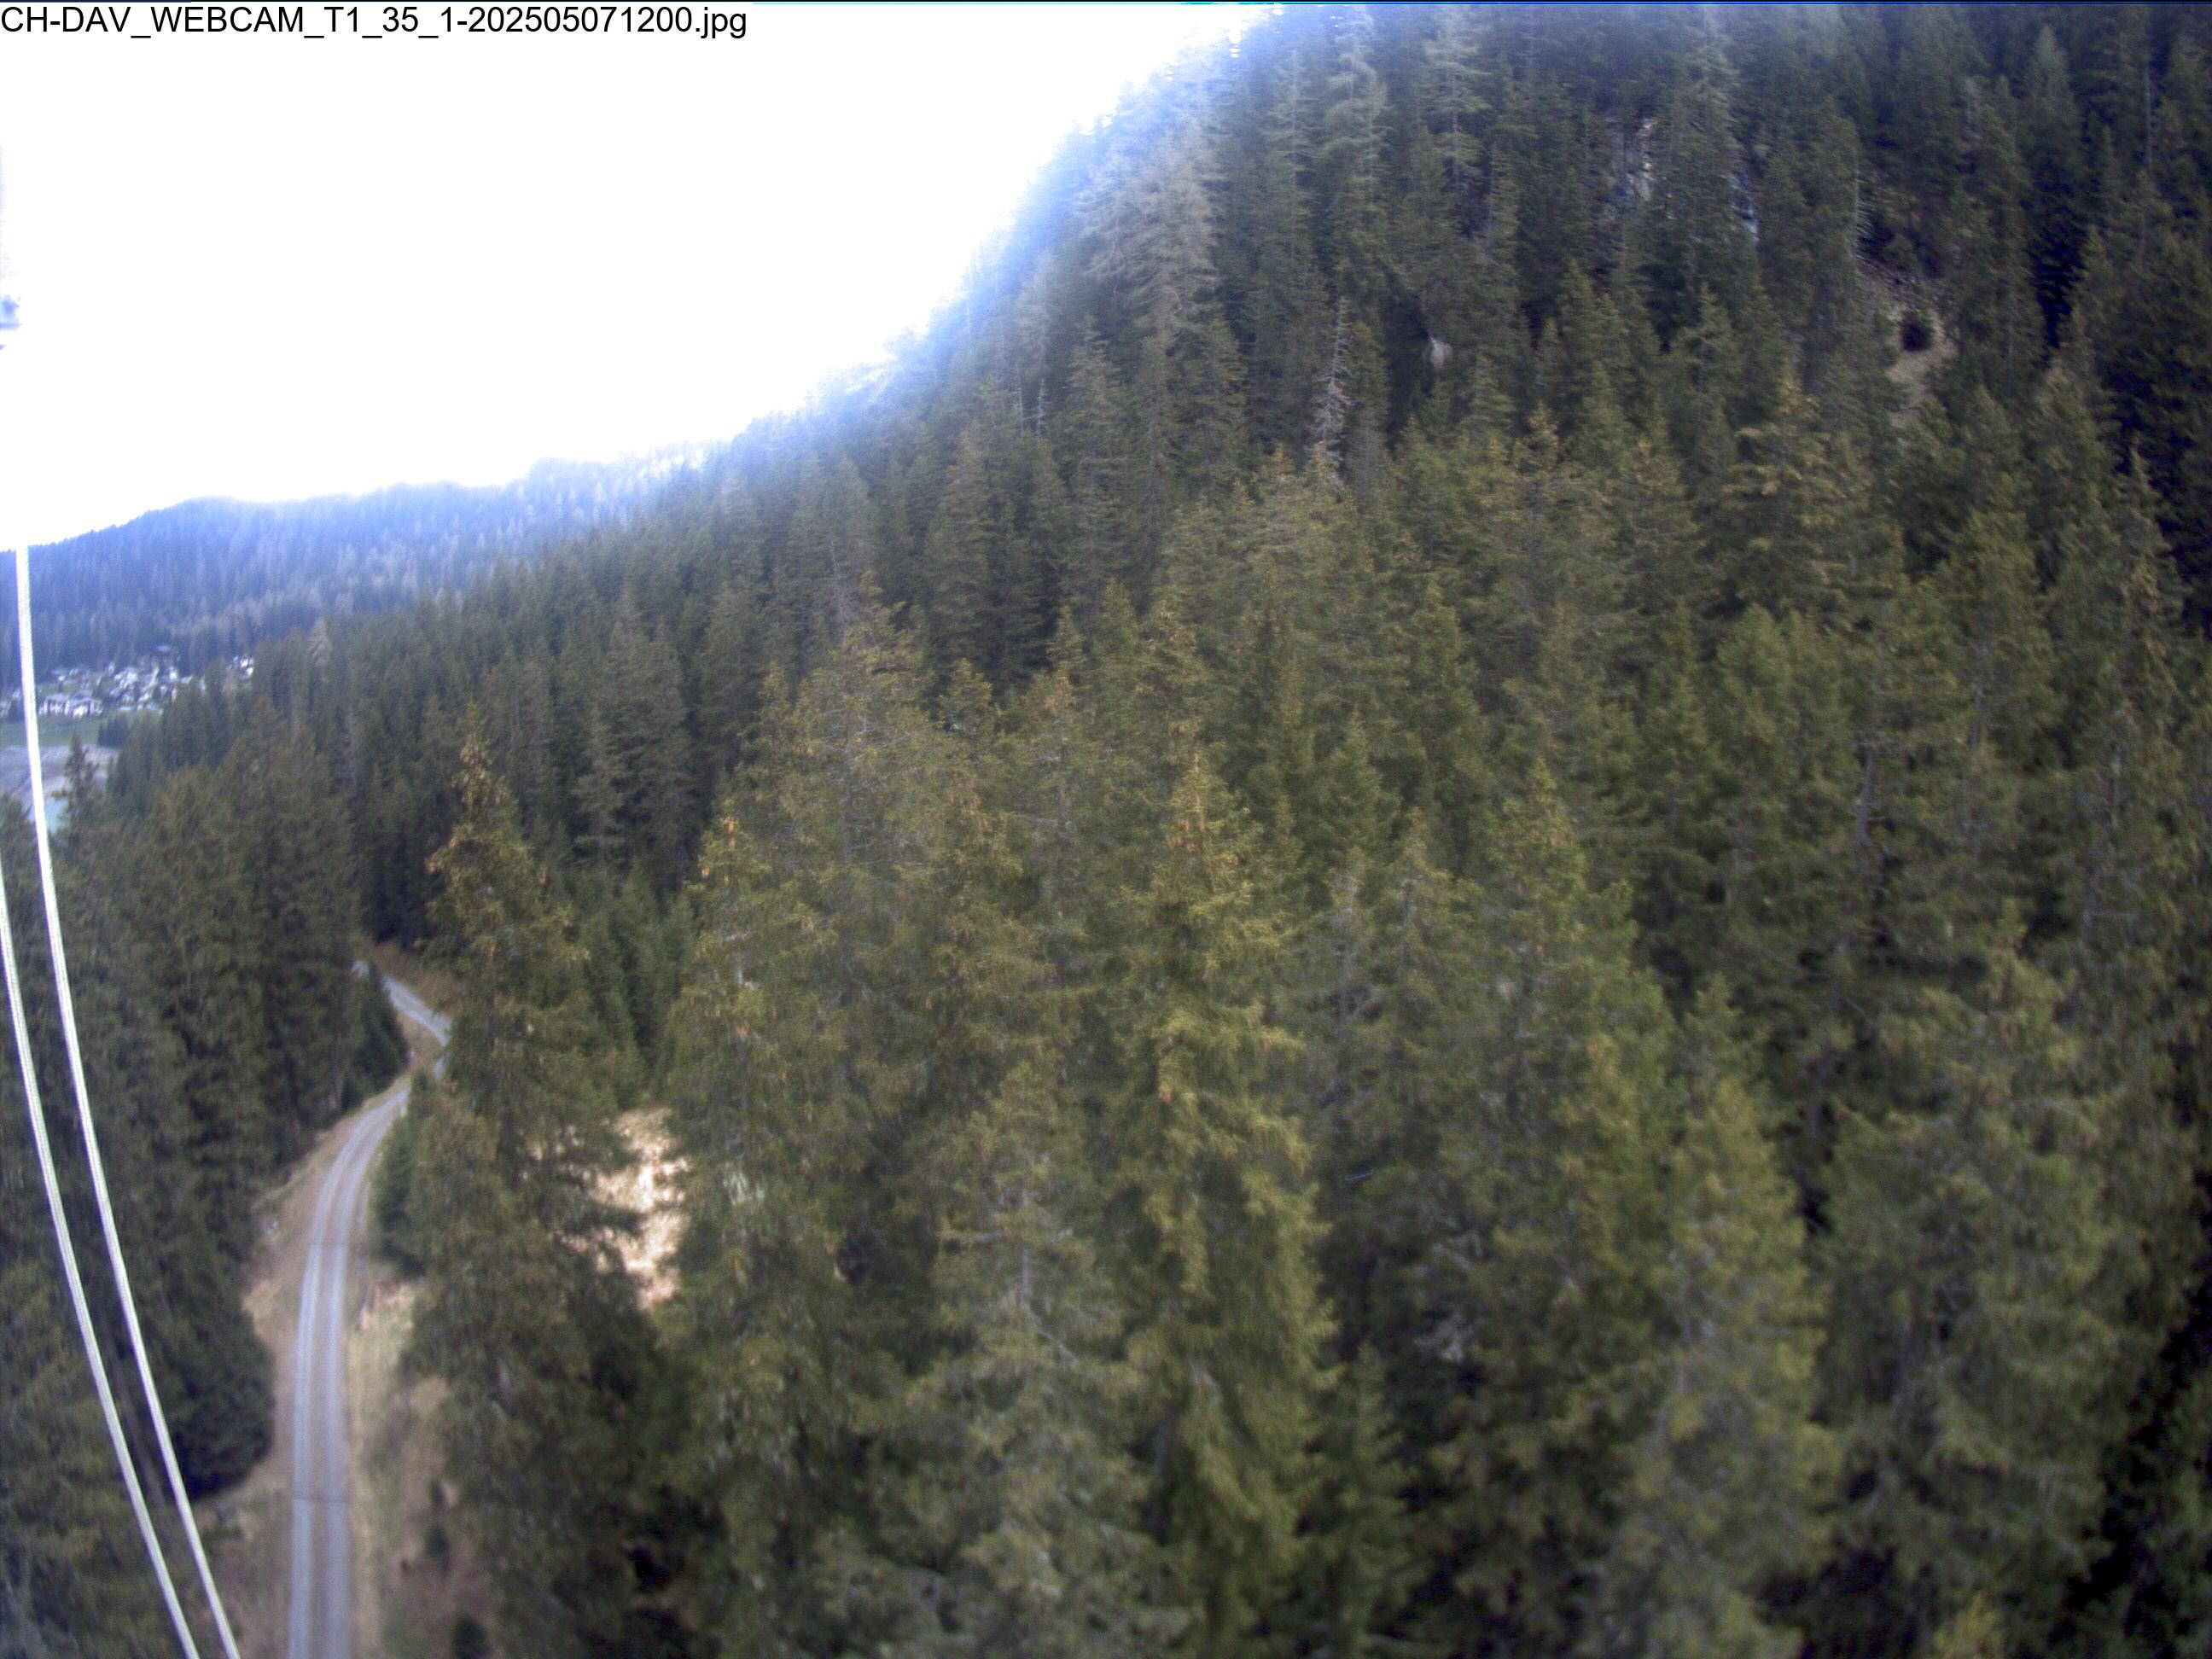
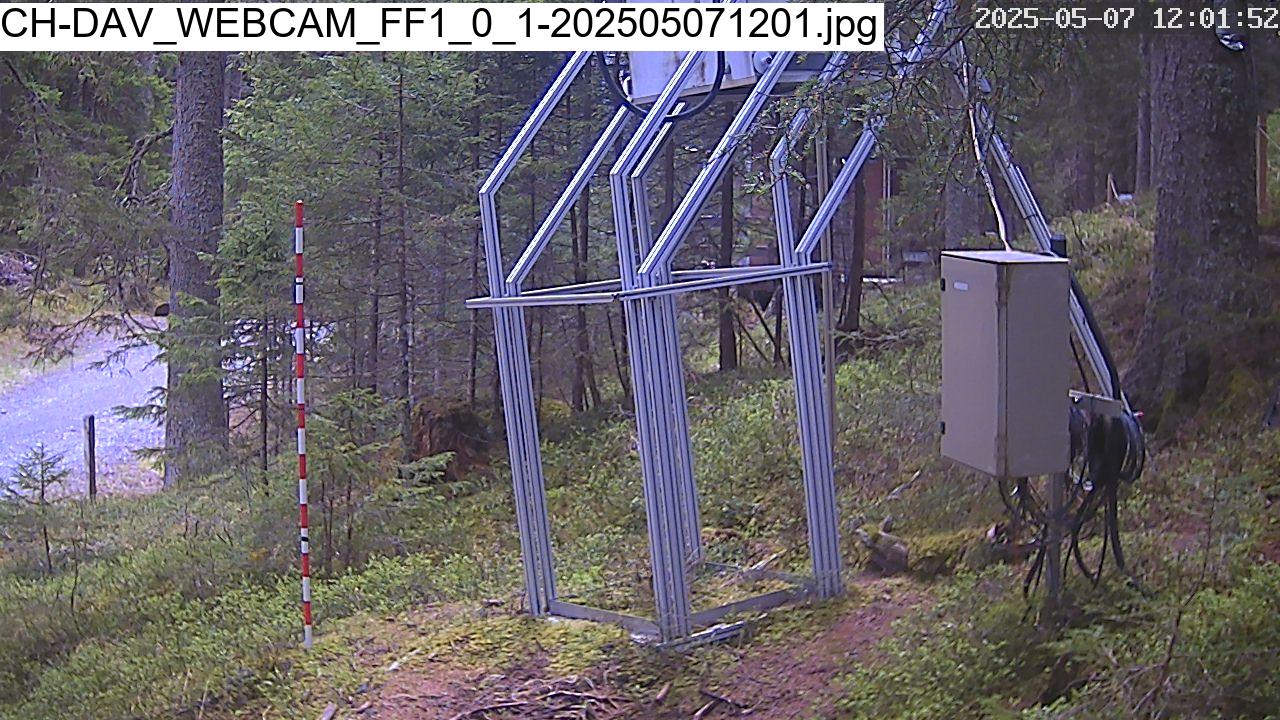
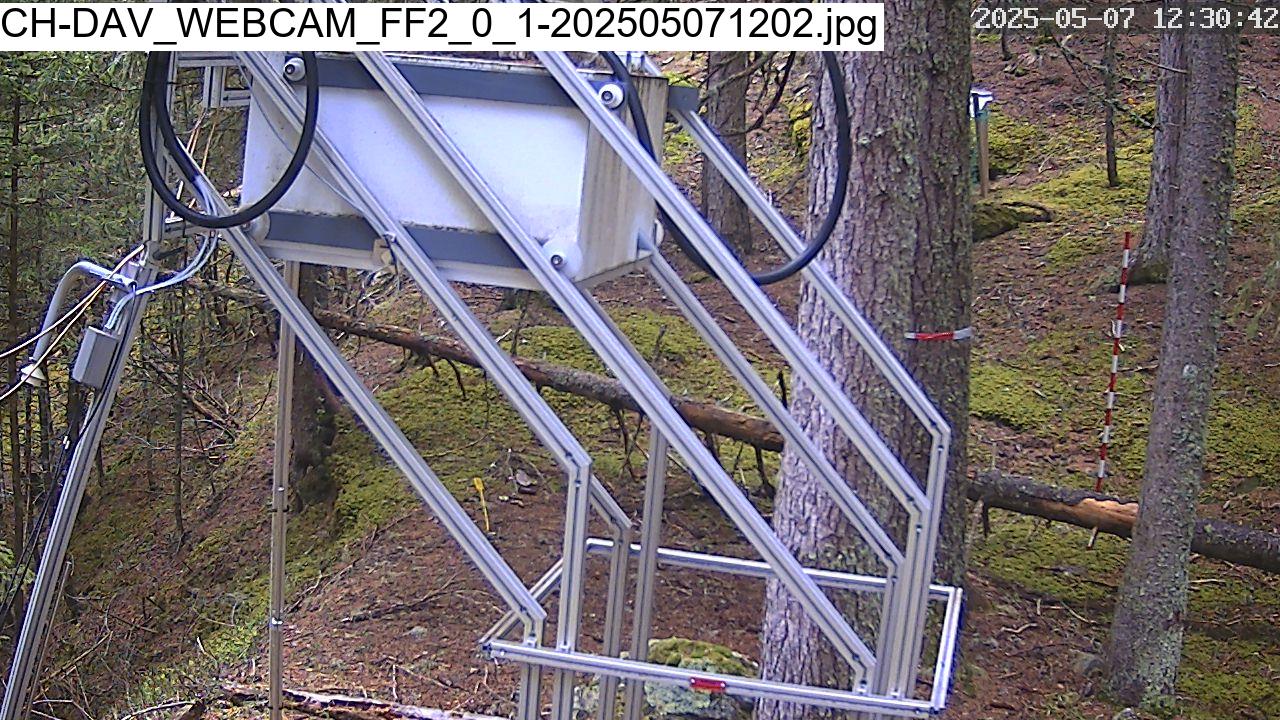
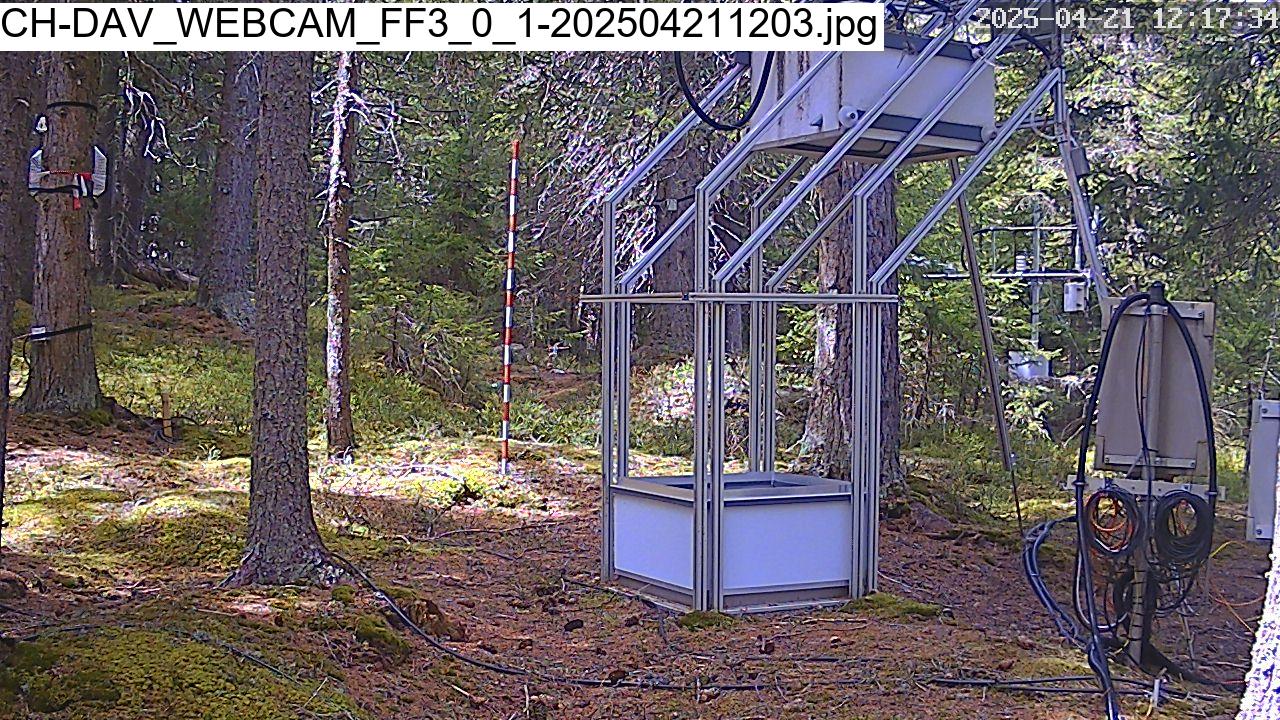
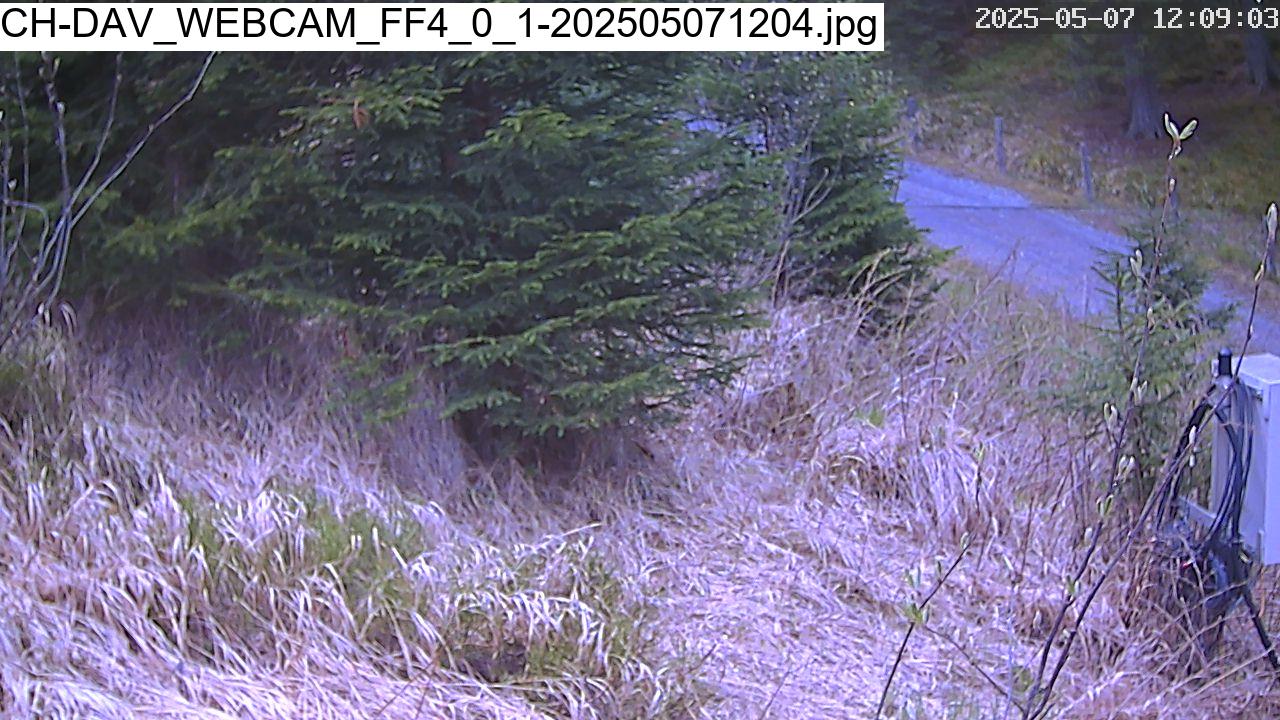
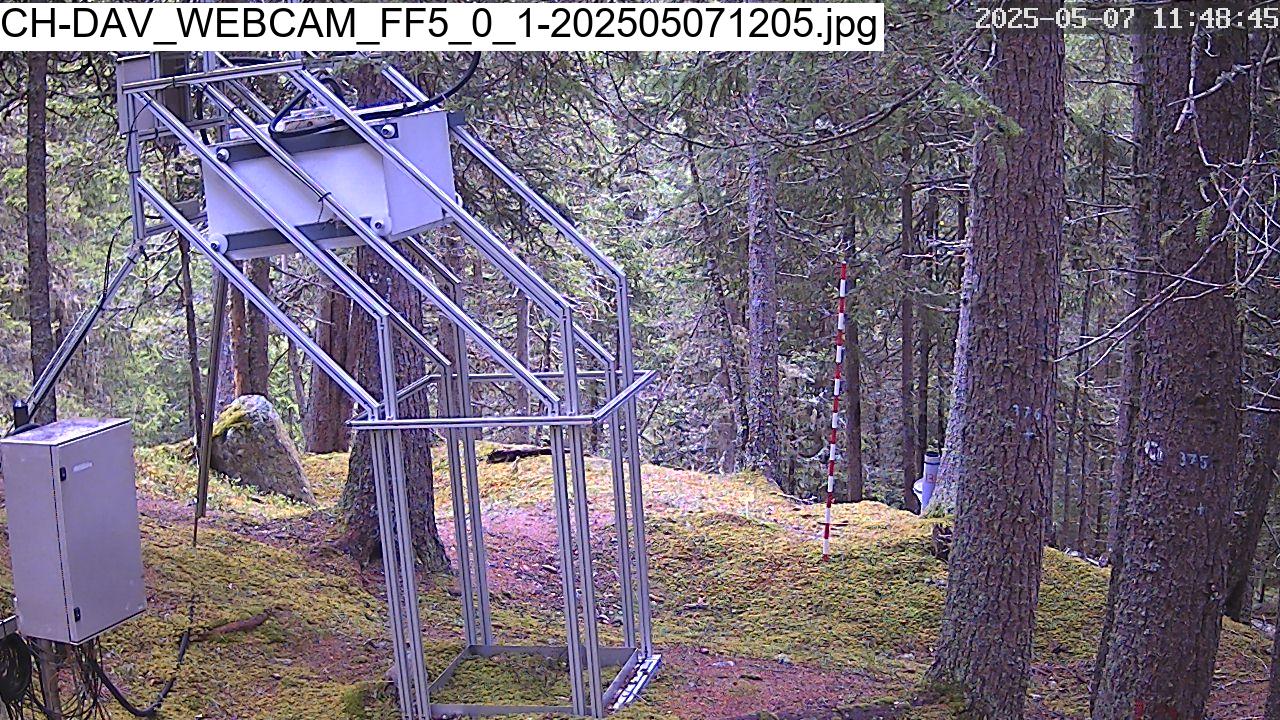
Webcam
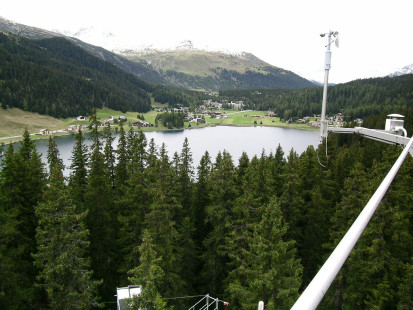
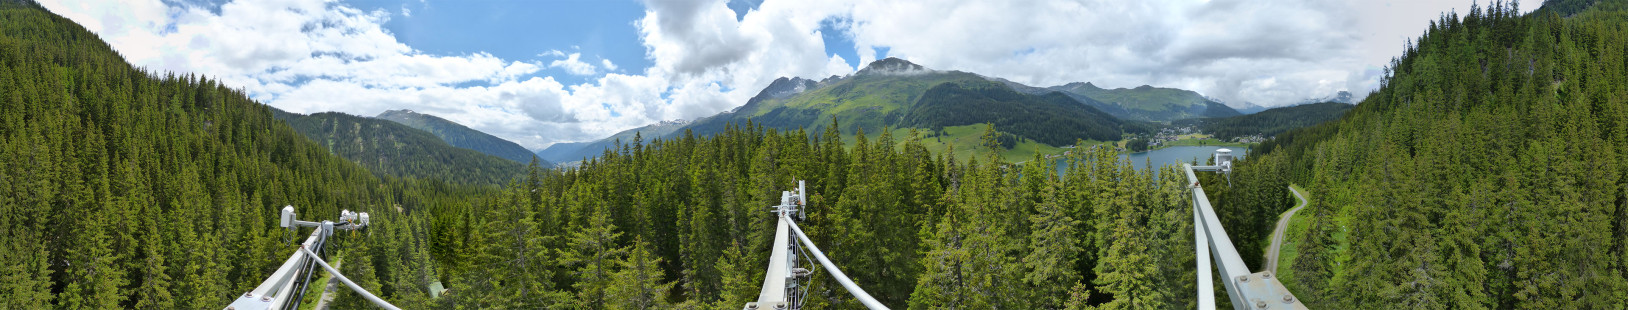
- 360° view from top of the Davos station which is part of the external research project SwissPhenocam
- Most recent images from the main tower and Forest Floors 1-5
 |
 |
 |
 |
 |
 |
Fieldbook
News
Short Report – QA/QC Meeting 19 Jun 2025
Short Report – QA/QC Meeting 22 May 2025
Short Report – QA/QC Meeting 3 Apr 2025
More Info
- Publication list @ETH Grassland Sciences
- CH-DAV@WSL: Swiss Federal Institute of Forest, Snow and Landscape Research WSL
- CH-DAV@ICOS Switzerland: Class 1 Ecosystem Station – Davos
- CH-DAV@ICOS Carbon Portal: https://meta.icos-cp.eu/resources/stations/ES_CH-Dav
Last Updated on 7 Jun 2025 10:41