CH-CHA, Chamau
Contents
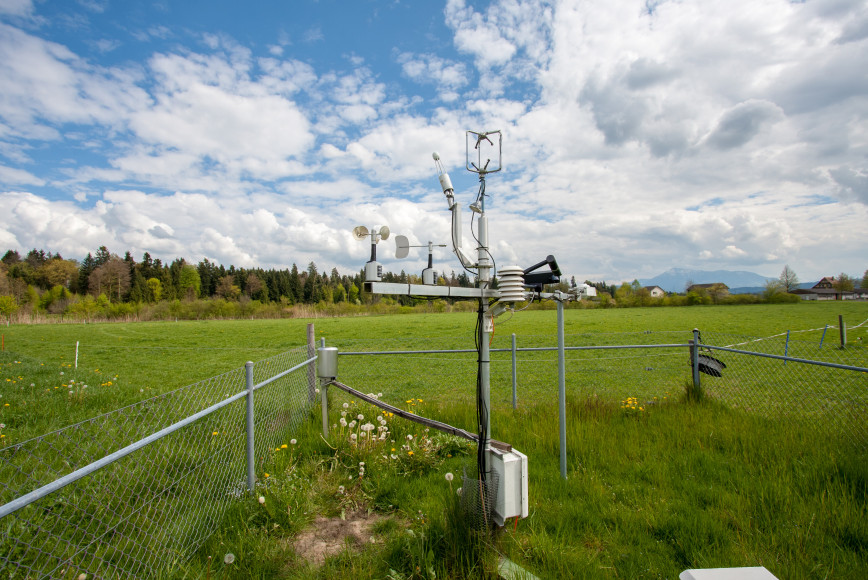
Site Description
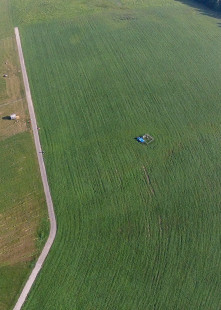
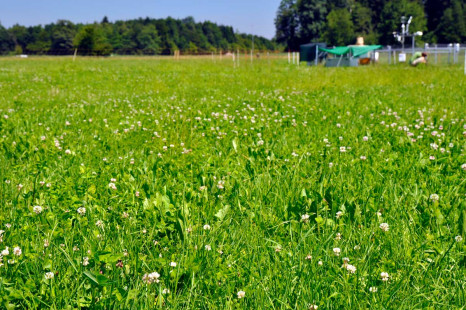
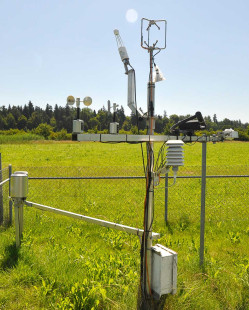
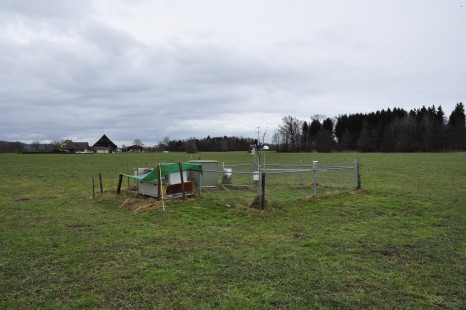
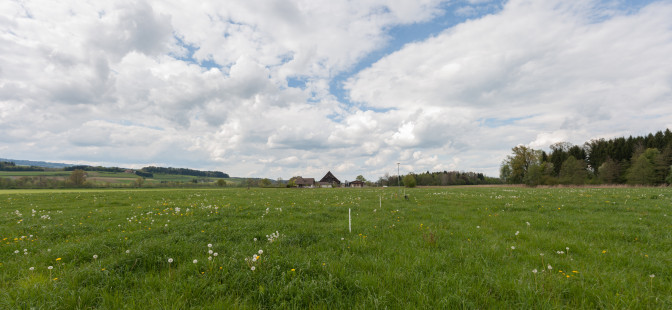
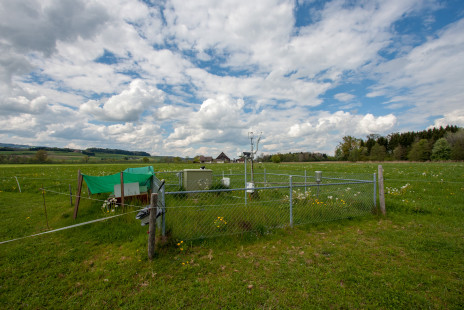
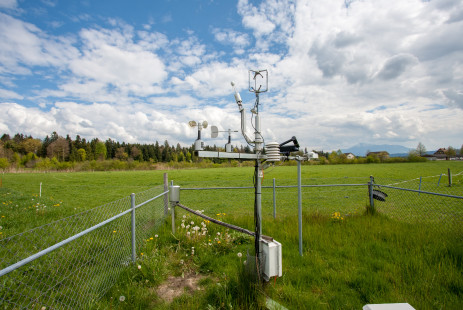
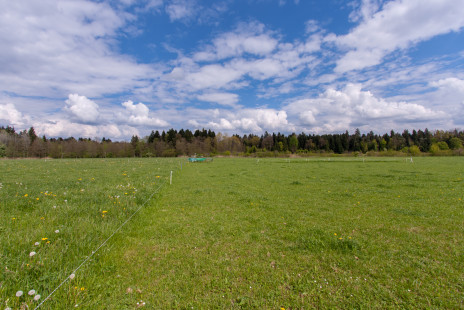
Intensively managed grassland, 393 m asl, located in a pre-alpine valley bottom. The area and the adjacent farm are part of the Agricultural Education and Counseling Center Schluechthof. Eddy covariance flux measurements were started in July 2005 (tower coordinates: 47°12’36.8″ N and 8°24’37.6″ E (Google Maps); WGS84 47.210222, 8.410444; at 393 m asl).
Location
- Altitude: 393 m a.s.l.
- Site name: Chamau, Kt. Zug, Switzerland
- Land cover (IGBP land classification): Grassland
- Land use: Intensive management with six cuts per year (mainly for silage).
- Coordinates: 47°12’36.8″ N / 8°24’38.3″ E (47.210227, 8.410645) (Google Maps)
- Location description: Chamau is located in a lowland broad river valley of the Reuss River.
- FLUXNET ID: CH-Cha (link)
Climate
Air Temperature
Numbers shown are for the time period 2006-2024.
- Average air temperature: 10.0°C
- Average air temperature 2006-2015: 9.6°C
- Average air temperature 2015-2023: 10.4°C (+0.8°C compared to 2006-2015)
- 5 warmest years: 2022 (11.1°C), 2018 (11.0°C), 2023 (10.8°C), 2024 (10.6°C), 2020 (10.6°C)
- 6 coolest years: 2010 (8.6°C), 2013 (9.0°C), 2021 (9.5°C), 2012 (9.5°C), 2006 (9.5°C), 2008 (9.5°C)
Climate chart
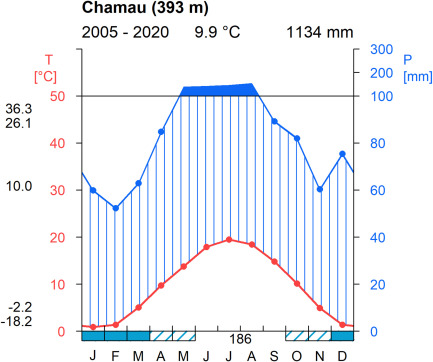
Precipitation
- Average annual precipitation sum: 1134mm (2005-2020)
Nearby meteo stations
- Meteoswiss: Cham (Google Maps) Data since: 1 Jul 1993 | 443 m a.s.l. | in 5 km distance
- Meteoswiss: Oberägeri (Google Maps) Data since: 1 Feb 1993 | 724 m a.s.l. | in 17 km distance
- Meteoswiss: Wädemswil (Google Maps) Data since: 1 Jan 1961 | 485 m a.s.l. | in 20 km distance
- Meteoswiss: Zwillikon (Google Maps) Data since: 1 May 1984 | 461 m a.s.l. | in 9 km distance
Vegetation
- Dominant vegetation: mixture of Italian ryegrass (Lolium multiflorum) and white clover (Trifolium repens L.), predominantly used for fodder production and occasional winter grazing by sheep. 1,2

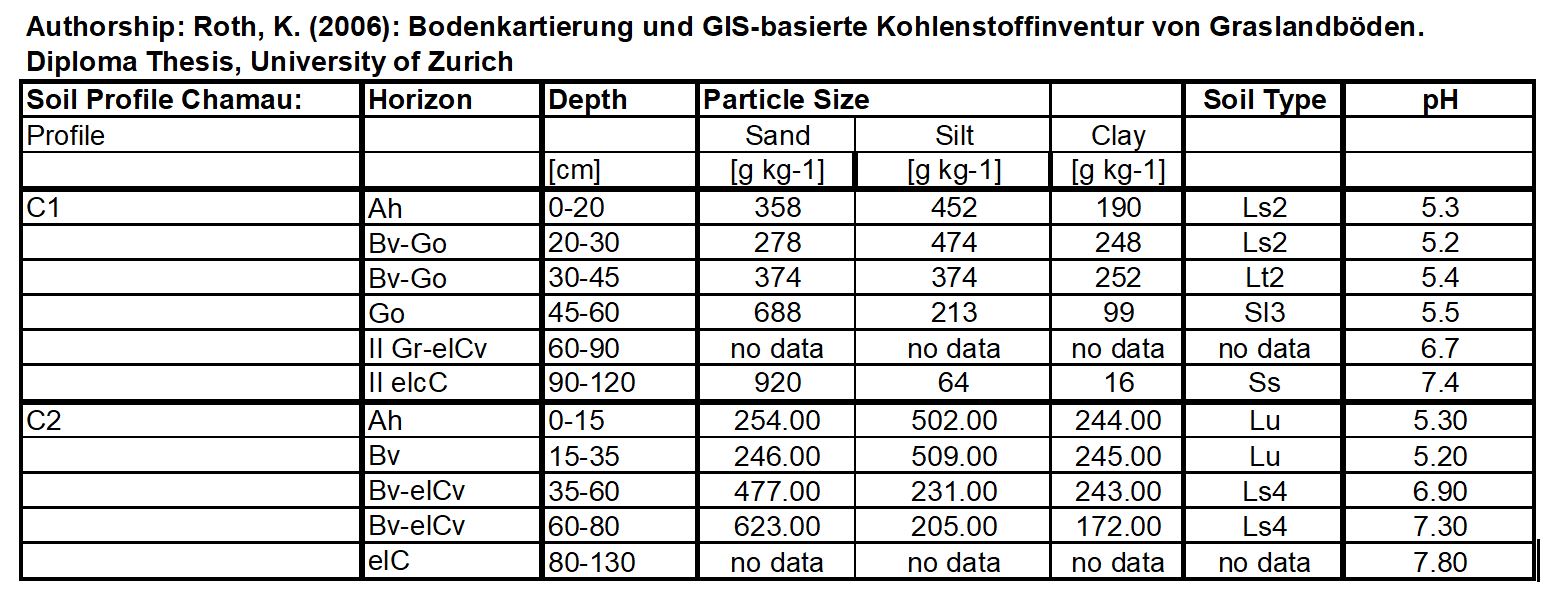
Soil
- Geology: The area is located on tertiary molasse. The Reuss-valley is filled with postglacial retreating rubble of the Reuss glacier.
- Soil type: Cambisol/Gleysol
- Soil pH: 5.3 in the top 10 cm of the soil 4
- Soil texture:
Management
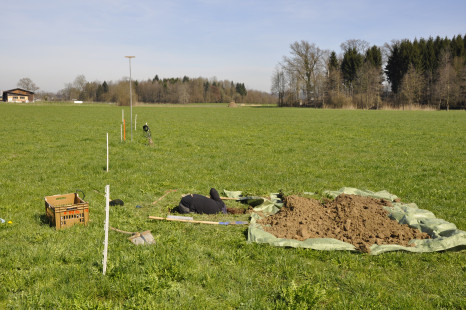
- Intensively managed grassland with recurrent of sporadic activities.
- Regular mowing and subsequent organic fertilizer application in the form of liquid slurry (up to seven times per year).
- Occasional grazing by sheep and cattle for a few days in early spring and/or fall.
- Sporadic activities aiming at maintaining the typical fodder species composition comprise reseeding, herbicide and pesticide application, or irregular plowing and harrowing on an approximately decadal timescale.
- For more info see references 1,2,3,4.
Detailed Management Info
Download management XLSX file (CH-CHA-Management_2005-2024_20250107.xlsx)
- See also this table for management 2001-2016: Management (CH-CHA)
Data
Current Flux Products
Available Level-1 Fluxes
- For info about the different flux levels, see Flux Processing Chain
- For more info about the processing, see the Yearly Notes and other pages in the documentation describing the PI dataset (Flux Product).
| wdt_ID | Site & Year | SA | GA | CO2 | H2O | N2O | CH4 | Current Version | EFDC Version | EFDC Upload | EFDC Calcs |
|---|---|---|---|---|---|---|---|---|---|---|---|
| 19 | CH-CHA 2016 | R350 | IRGA75 | CO2 | H2O | FF-202407 | FF-202407 | 20 Apr 2025 | UPDATE | ||
| 20 | CH-CHA 2017 | R350 | IRGA75 | CO2 | H2O | FF-202407 | FF-202407 | 20 Apr 2025 | UPDATE | ||
| 21 | CH-CHA 2018 | R350 | IRGA75 | CO2 | H2O | FF-202407 | FF-202407 | 20 Apr 2025 | UPDATE | ||
| 22 | CH-CHA 2015 | R350 | IRGA75 | CO2 | H2O | FF-202407 | FF-202407 | 20 Apr 2025 | UPDATE | ||
| 23 | CH-CHA 2014 | R350 | IRGA75 | CO2 | H2O | FF-202407 | FF-202407 | 20 Apr 2025 | UPDATE | ||
| 24 | CH-CHA 2013 | R350 | IRGA75 | CO2 | H2O | FF-202407 | FF-202407 | 20 Apr 2025 | UPDATE | ||
| 25 | CH-CHA 2012 | R350 | IRGA75 | CO2 | H2O | FF-202407 | FF-202407 | 20 Apr 2025 | UPDATE | ||
| 26 | CH-CHA 2011 | R350 | IRGA75 | CO2 | H2O | FF-202407 | FF-202407 | 20 Apr 2025 | UPDATE | ||
| 27 | CH-CHA 2010 | R350 | IRGA75 | CO2 | H2O | FF-202407 | FF-202407 | 20 Apr 2025 | UPDATE | ||
| 28 | CH-CHA 2009 | R350 | IRGA75 | CO2 | H2O | FF-202407 | FF-202407 | 20 Apr 2025 | UPDATE | ||
| 29 | CH-CHA 2008 | R350 | IRGA75 | CO2 | H2O | FF-202407 | FF-202407 | 20 Apr 2025 | UPDATE | ||
| 30 | CH-CHA 2007 | R350 | IRGA75 | CO2 | H2O | FF-202407 | FF-202407 | 20 Apr 2025 | UPDATE | ||
| 31 | CH-CHA 2006 | R350 | IRGA75 | CO2 | H2O | FF-202407 | FF-202407 | 20 Apr 2025 | UPDATE | ||
| 32 | CH-CHA 2005 | R350 | IRGA75 | CO2 | H2O | FF-202407 | FF-202407 | 20 Apr 2025 | UPDATE | ||
| 33 | CH-CHA QCLLGR 2015 | R350 | QCL | N2O | CH4 | FF-202407 | FF-202407 | 28 Feb 2025 | UPDATE | ||
| 34 | CH-CHA QCLLGR 2014 | R350 | QCL | N2O | CH4 | FF-202407 | FF-202407 | 28 Feb 2025 | UPDATE | ||
| 35 | CH-CHA QCLLGR 2013 | R350 | QCL | N2O | CH4 | FF-202407 | FF-202407 | 28 Feb 2025 | UPDATE | ||
| 36 | CH-CHA QCLLGR 2012 | R350 | QCL | N2O | CH4 | FF-202407 | FF-202407 | 28 Feb 2025 | UPDATE | ||
| 143 | CH-CHA QCLLGR 2020 | R350 | QCL | N2O | CH4 | FF-202407 | FF-202407 | 28 Feb 2025 | NEW | ||
| 144 | CH-CHA QCLLGR 2021 | R350 | QCL/LGR | N2O | CH4 | FF-202407 | FF-202407 | 28 Feb 2025 | NEW | ||
| 145 | CH-CHA QCLLGR 2022 | R350 | LGR | N2O | CH4 | FF-202407 | FF-202407 | 28 Feb 2025 | NEW | ||
| 140 | CH-CHA QCLLGR 2017 | R350 | QCL | N2O | CH4 | FF-202407 | FF-202407 | 28 Feb 2025 | NEW | ||
| 141 | CH-CHA QCLLGR 2018 | R350 | QCL | N2O | CH4 | FF-202407 | FF-202407 | 28 Feb 2025 | NEW | ||
| 142 | CH-CHA QCLLGR 2019 | R350 | QCL | N2O | CH4 | FF-202407 | FF-202407 | 28 Feb 2025 | NEW | ||
| 137 | CH-CHA 2022 | R350 | IRGA75 | CO2 | H2O | FF-202407 | FF-202407 | 20 Apr 2025 | UPDATE | ||
| 138 | CH-CHA 2021 | R350 | IRGA75 | CO2 | H2O | FF-202407 | FF-202407 | 20 Apr 2025 | UPDATE | ||
| 139 | CH-CHA QCLLGR 2016 | R350 | QCL | N2O | CH4 | FF-202407 | FF-202407 | 28 Feb 2025 | NEW | ||
| 126 | CH-CHA 2019 | R350 | IRGA75 | CO2 | H2O | FF-202407 | FF-202407 | 20 Apr 2025 | UPDATE | ||
| 127 | CH-CHA 2020 | R350 | IRGA75 | CO2 | H2O | FF-202407 | FF-202407 | 20 Apr 2025 | UPDATE | ||
| 146 | CH-CHA 2023 | R350 | IRGA75 | CO2 | H2O | FF-202503 | FF-202503 | 20 Apr 2025 | UPDATE | ||
| 147 | CH-CHA 2024 | R350 | IRGA75 | CO2 | H2O | FF-202501 | FF-202501 | 20 Apr 2025 | NEW | ||
| Site & Year | SA | GA | CO2 | H2O | N2O | CH4 | Current Version | EFDC Version | EFDC Upload | EFDC Calcs |
Eddy covariance raw data files
- Overview of eddy covariance raw data files since 2005: EC Raw Binary Format (CH-CHA)
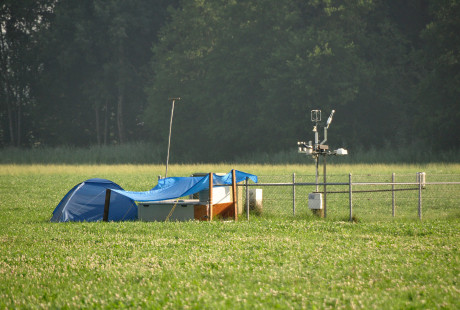
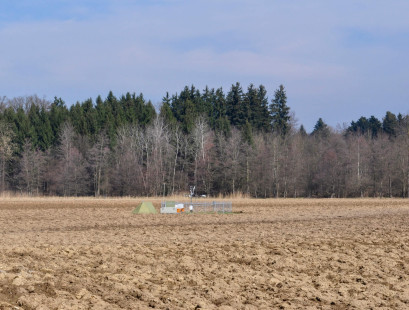
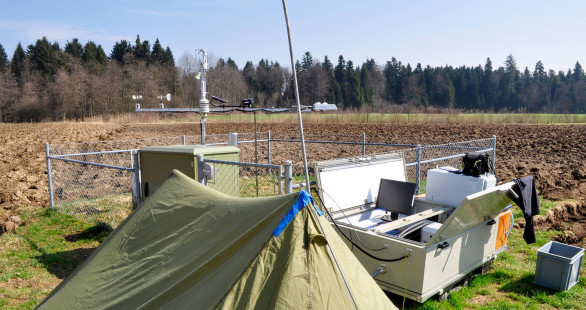
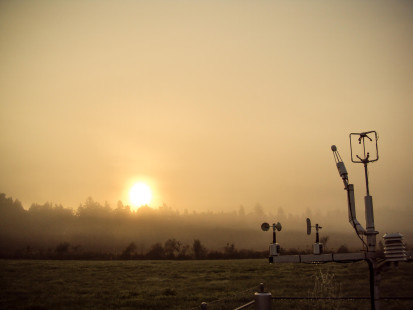
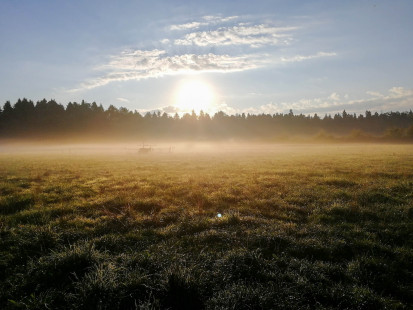
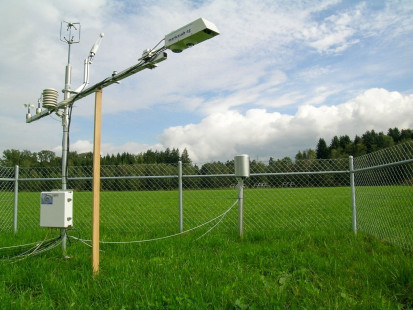
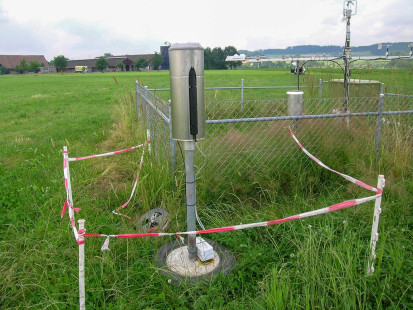
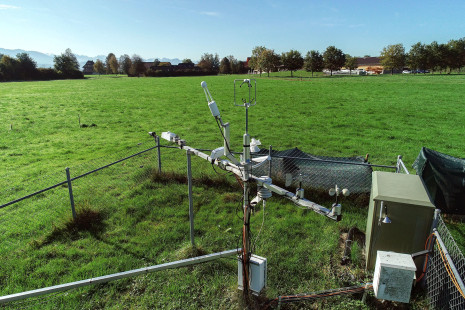
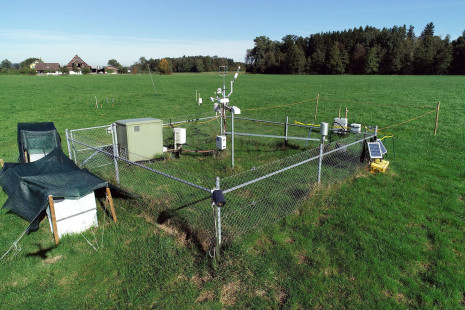
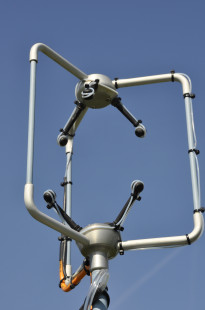
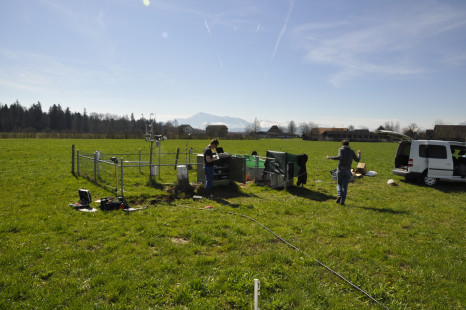
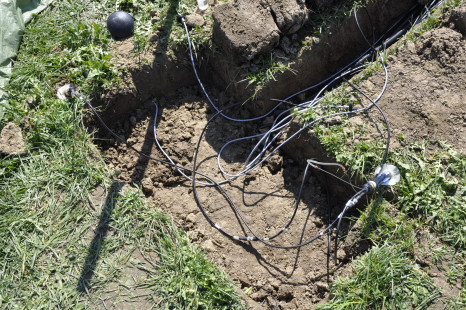
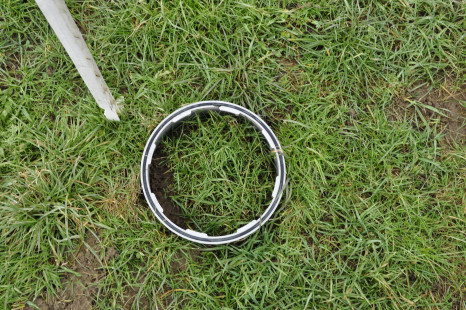
Photos


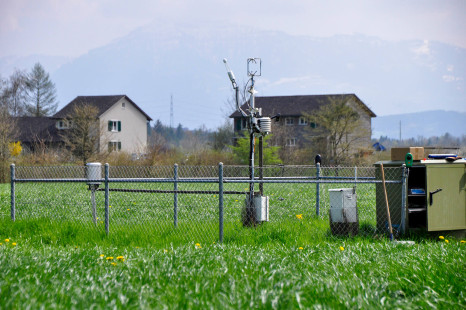
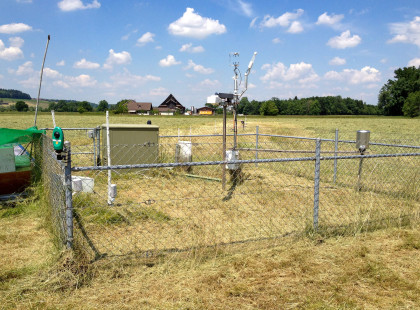
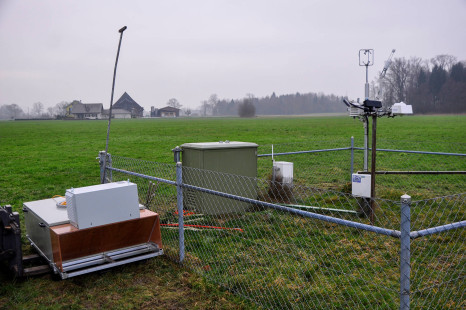
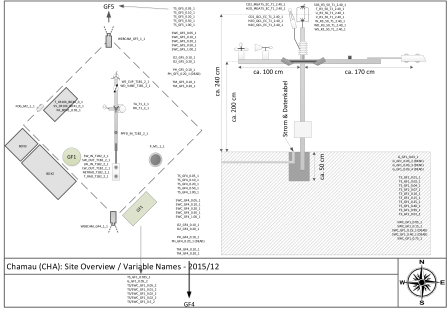
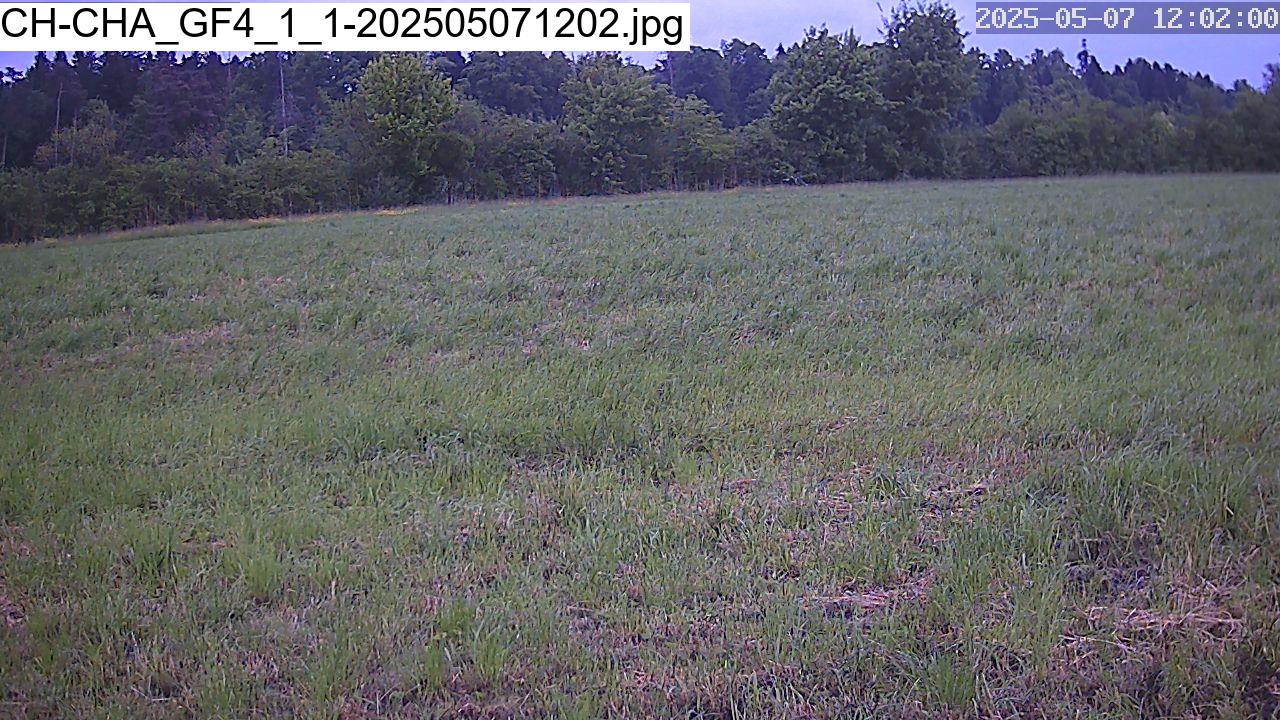
Webcam
- Most recent image from Grassland Floor 4 (GF4)
Fieldbook
News
Short Report – QA/QC Meeting 19 Jun 2025
Short Report – QA/QC Meeting 22 May 2025
Short Report – QA/QC Meeting 3 Apr 2025
References
1 Zeeman, M. J., Hiller, R., Gilgen, A. K., Michna, P., Plüss, P., Buchmann, N., & Eugster, W. (2010). Management and climate impacts on net CO2 fluxes and carbon budgets of three grasslands along an elevational gradient in Switzerland. Agricultural and Forest Meteorology, 150(4), 519–530. doi: 10.1016/j.agrformet.2010.01.011
2 Merbold, L., Decock, C., Eugster, W., Fuchs, K., Wolf, B., Buchmann, N., & Hörtnagl, L. (2021). Are there memory effects on greenhouse gas emissions (CO2, N2O and CH4) following grassland restoration? Biogeosciences, 18(4), 1481–1498. doi: 10.5194/bg-18-1481-2021
3 Merbold, L., Eugster, W., Stieger, J., Zahniser, M., Nelson, D., & Buchmann, N. (2014). Greenhouse gas budget (CO2 , CH4 and N2O) of intensively managed grassland following restoration. Global Change Biology, 20(6), 1913–1928. doi: 10.1111/gcb.12518
4 Feigenwinter, I., Hörtnagl, L., Zeeman, M. J., Eugster, W., Fuchs, K., Merbold, L., & Buchmann, N. (2023). Large inter-annual variation in carbon sink strength of a permanent grassland over 16 years: Impacts of management practices and climate. Agricultural and Forest Meteorology, 340, 109613. https://doi.org/10.1016/j.agrformet.2023.109613
More Info
Last Updated on 6 Jul 2025 22:41