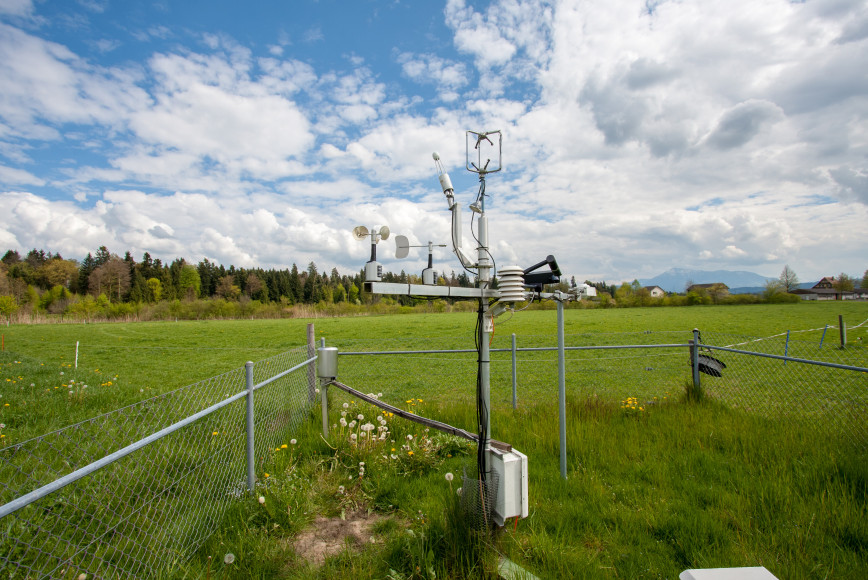
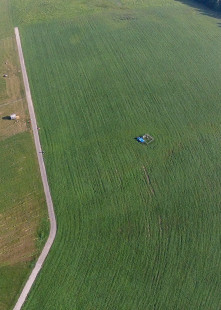
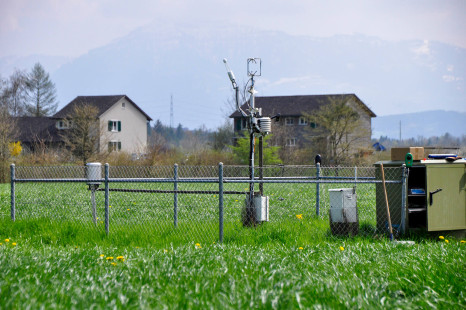
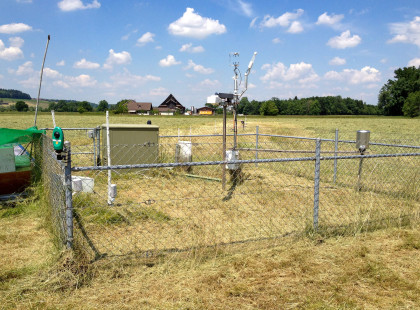
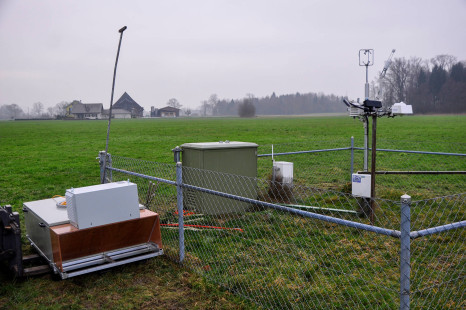
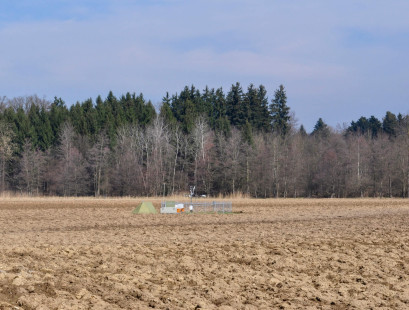
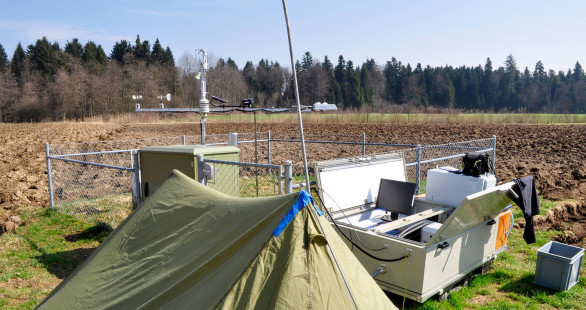
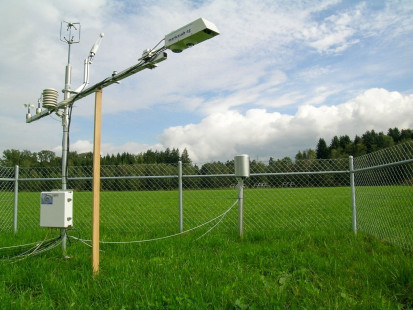
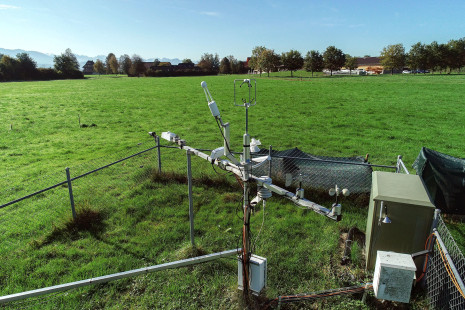
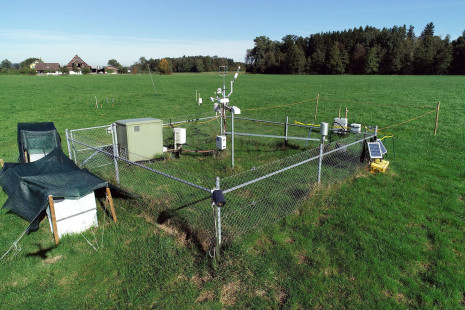
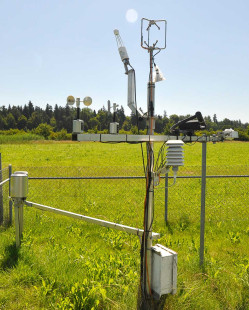
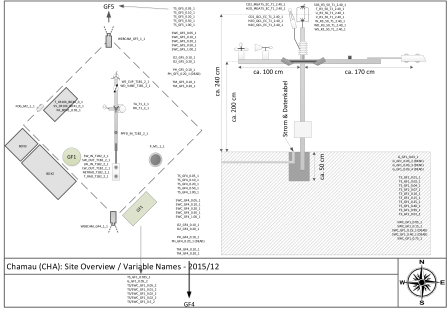
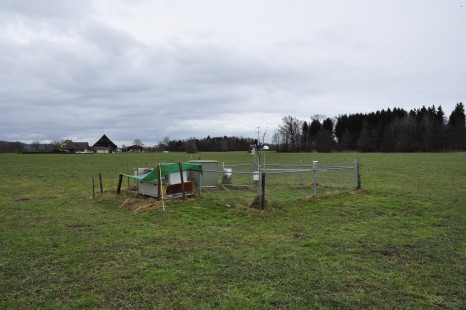
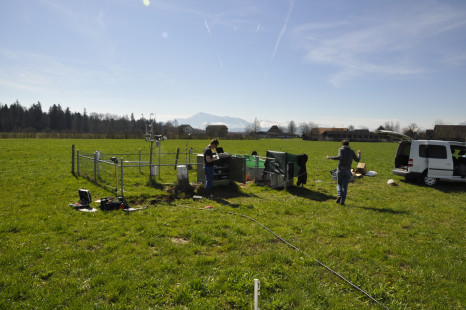
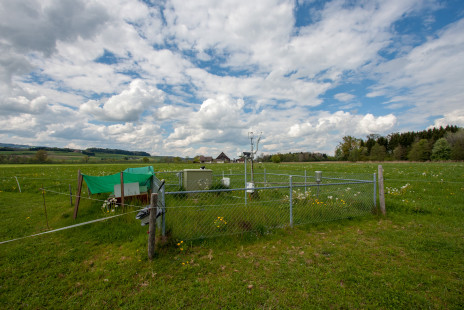
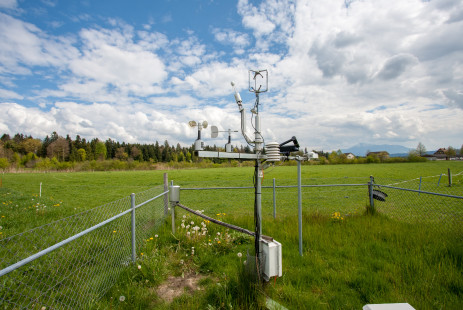
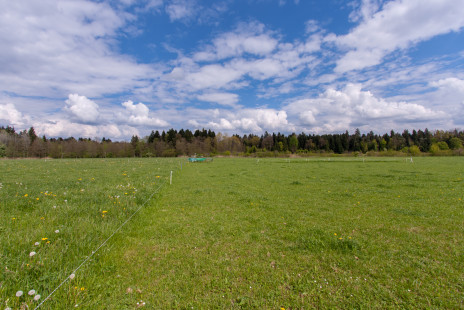
Intensively managed grassland, 393 m asl, located in a pre-alpine valley bottom. The area and the adjacent farm are part of the Agricultural Education and Counseling Center Schluechthof. Eddy covariance flux measurements were started in July 2005 (tower coordinates: 47°12’36.8″ N and 8°24’37.6″ E (Google Maps); WGS84 47.210222, 8.410444; at 393 m asl).
Location
Altitude: 393 m a.s.l.
Site name: Chamau, Kt. Zug, Switzerland
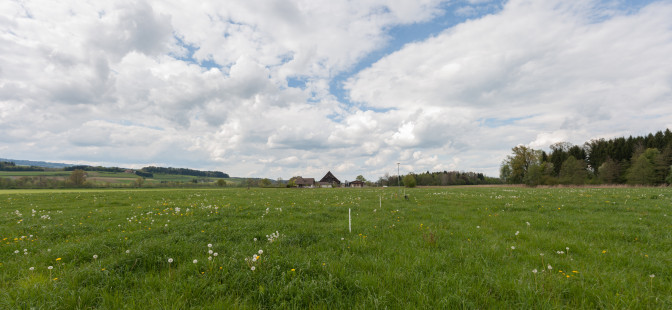
Land cover (IGBP land classification): Grassland
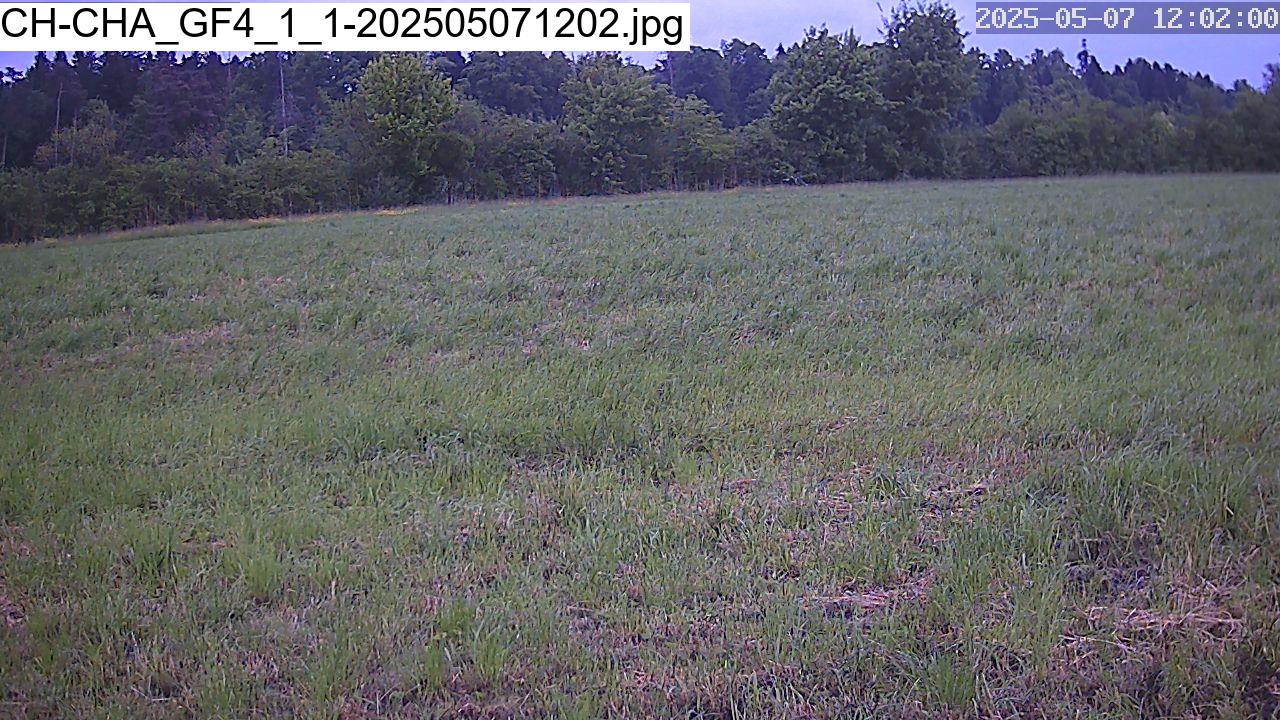
Land use: Intensive management with six cuts per year (mainly for silage).
Coordinates: 47°12’36.8″ N / 8°24’38.3″ E (47.210227, 8.410645) (Google Maps)
Location description: Chamau is located in a lowland broad river valley of the Reuss River.
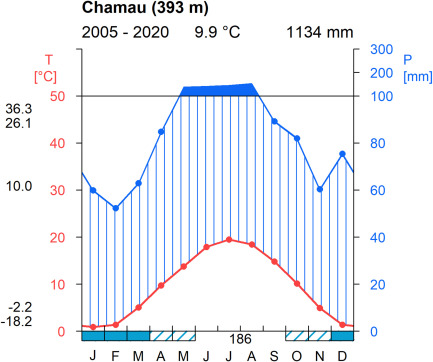
Climate chart after Walter and Lieth (1967) for Chamau for the years 2005 to 2020. Mean monthly temperature (red line) and mean monthly precipitation sum (blue line) are shown. Blue vertically hatched area shows the humid period of the year, blue filled area indicates months with precipitation greater than 100 mm (axis scale changes > 100 mm). Average annual temperature and average annual precipitation sum are listed in black at the top. Maximum measured temperature (from half-hourly values), mean daily maximum temperature of the warmest month (July), mean annual temperature amplitude, mean daily minimum temperature of the coldest month (January) and minimum measured temperature are listed as black numbers on the left. Petrol shaded areas on the x axis indicate the months where the mean daily minimum temperature is lower than 0 °C, and petrol hatched areas the months with absolute minimum temperature of 0 °C (frost possible). The number in the middle of the x axis states the mean duration of consecutive frost-free days (when temperature does not drop below 0). Source: Feigenwinter et al. (2023)
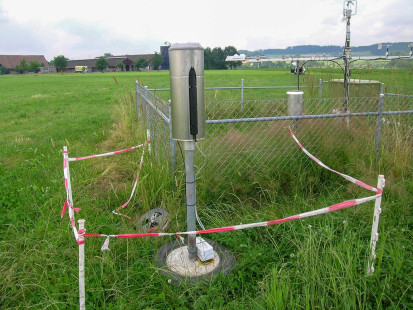
Precipitation
Average annual precipitation sum: 1134mm (2005-2020)
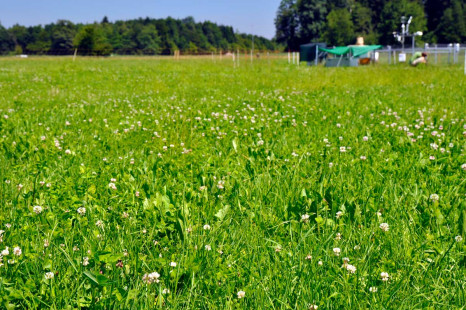
Dominant vegetation: mixture of Italian ryegrass (Lolium multiflorum) and white clover (Trifolium repens L.), predominantly used for fodder production and occasional winter grazing by sheep. 1,2
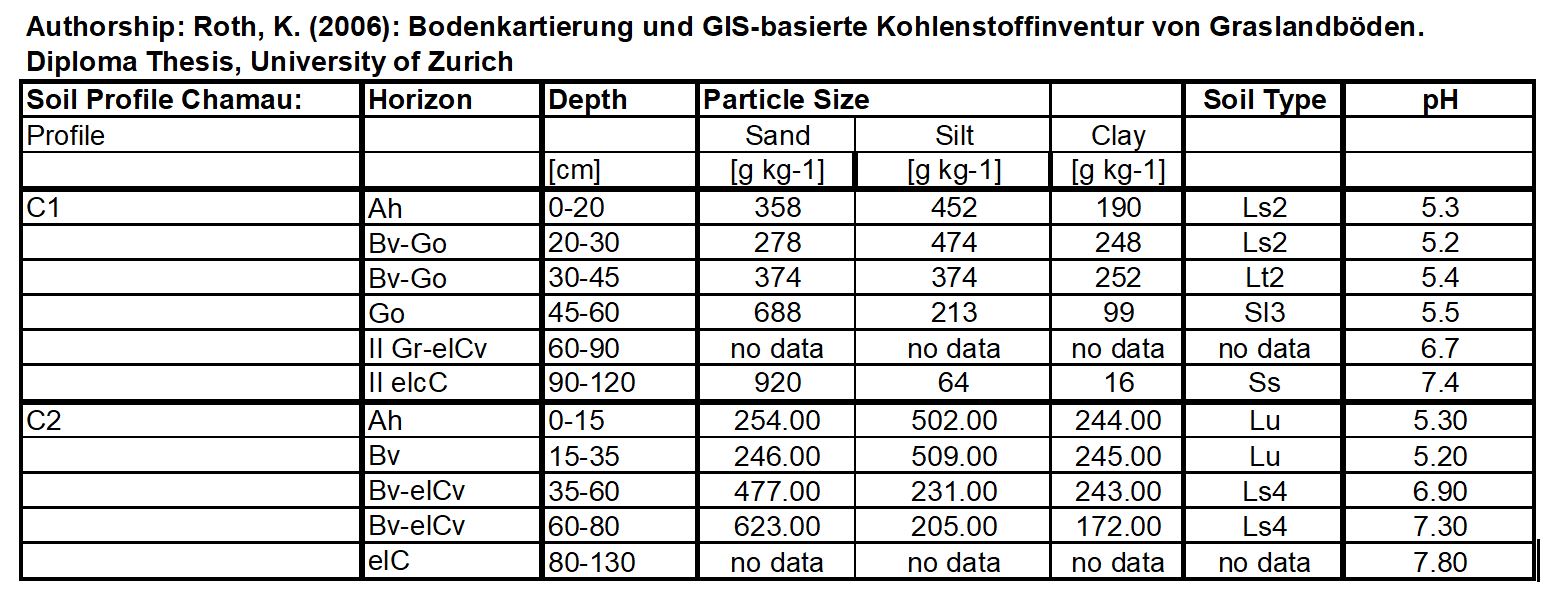
Soil
Geology: The area is located on tertiary molasse. The Reuss-valley is filled with postglacial retreating rubble of the Reuss glacier.
Soil type: Cambisol/Gleysol
Soil pH: 5.3 in the top 10 cm of the soil 4
Soil texture:
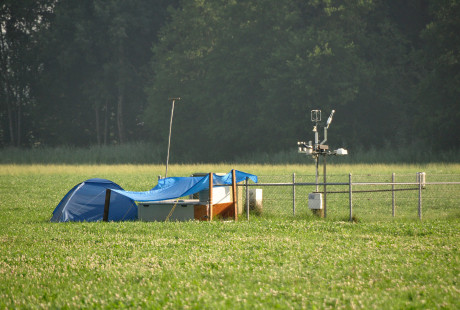
Management
Intensively managed grassland with recurrent of sporadic activities.
Regular mowing and subsequent organic fertilizer application in the form of liquid slurry (up to seven times per year).
Occasional grazing by sheep and cattle for a few days in early spring and/or fall.
Sporadic activities aiming at maintaining the typical fodder species composition comprise reseeding, herbicide and pesticide application, or irregular plowing and harrowing on an approximately decadal timescale.
The new Short Report with an overview of recent fluxes and meteo data can be downloaded from here: Short Report - QAQC Meeting 21 Mar 2024 (PDF) ... Read More
The new Short Report with an overview of recent fluxes and meteo data can be downloaded from here: Short Report - QAQC Meeting 22 Feb 2024.pdf ... Read More
1 Zeeman, M. J., Hiller, R., Gilgen, A. K., Michna, P., Plüss, P., Buchmann, N., & Eugster, W. (2010). Management and climate impacts on net CO2 fluxes and carbon budgets of three grasslands along an elevational gradient in Switzerland. Agricultural and Forest Meteorology, 150(4), 519–530. doi: 10.1016/j.agrformet.2010.01.011 2 Merbold, L., Decock, C., Eugster, W., Fuchs, K., Wolf, B., Buchmann, N., & Hörtnagl, L. (2021). Are there memory effects on greenhouse gas emissions (CO2, N2O and CH4) following grassland restoration? Biogeosciences, 18(4), 1481–1498. doi: 10.5194/bg-18-1481-2021 3 Merbold, L., Eugster, W., Stieger, J., Zahniser, M., Nelson, D., & Buchmann, N. (2014). Greenhouse gas budget (CO2 , CH4 and N2O) of intensively managed grassland following restoration. Global Change Biology, 20(6), 1913–1928. doi: 10.1111/gcb.12518 4 Feigenwinter, I., Hörtnagl, L., Zeeman, M. J., Eugster, W., Fuchs, K., Merbold, L., & Buchmann, N. (2023). Large inter-annual variation in carbon sink strength of a permanent grassland over 16 years: Impacts of management practices and climate. Agricultural and Forest Meteorology, 340, 109613. https://doi.org/10.1016/j.agrformet.2023.109613