Short Report – QA/QC Meeting Apr 2023
Meeting Date: 6 Apr 2023
Contents
News
- Automatic fluxes:
- Automatic Level-0 fluxes are calculated daily. (For info about flux levels see: Flux Processing Chain)
- It takes some time to process fluxes for all sites, but newest fluxes should show up in the database and thus Grafana after 12:00 noon.
- The simplified sequence what happens is:
- (1) EC raw data files are transferred to the ETH grasslandserver.
- (2) The Python script bico converts EC raw data files from binary to ASCII.
- (3) The Python script fluxrun calculates fluxes using the converted ASCII files.
- (4) The Python script dataflow scans the grasslandserver for available fluxes and uploads them to the database InfluxDB.
- (5) After upload the fluxes can be viewed in Grafana dashboards.
- New webcam script:
- There is a new page showing webcam images from our sites: Webcams. Note: the page currently works only in Firefox, not in Chrome and Edge. The issue has been identified and will be solved in the near future.
- The new webcam images have also been implemented on Grafana dashboards, e.g. on
Dashboards>All Sites>Webcams.
- Checking recent fluxes from our sites
General Info
- Attendance: If you are (Tech-)SRP, please attend QA/QC meetings or tell LH if you can’t, needed for planning of the meetings.
- Short statement: SRP & Tech-SRP: please prepare short statement about your site and post it on Slack together with the plot(s). You can also extend the already available text snippet(s) from previous meetings. (max. 2 sentences)
- Purpose: The purpose of QA/QC meetings is to check on current, incoming data. SRPs choose specific issues we should look at together and discuss in the group. Fluxes are checked if the respective SRP wishes to do so.
- Variables: There is a list of known variable abbreviations that you can use in case you wonder what an abbreviation means: Variable Abbreviations
- Check of EC raw data files:
- Recommended check for SRPs and T-SRPS: take a look at EC raw data files and check if they look OK
- Current EC raw data files are automatically converted to ASCII each day (done by the Python script bico)
- Files and their plots can be found here, e.g. for CH-LAS:
gl-processing\CH-LAS_Lae-Subcanopy\20_ec_fluxes\2022\raw_data_ascii
- Weekly flux calculations on the RDS:
- Please calculate fluxes and check them once per week, or more often if you wish to do so.
- If you cannot calculate the fluxes, try to find a substitute, e.g. LH.
- Please move your Level-0 results from the RDS to the respective Level-0 folder.
- Automatic upload of Level-0 fluxes to the database will be implemented soon.
- RDS folder: The folder
P:\Flux\RDS_calculationsis a temporary folder. Please move Level-0 flux calculations (preliminary fluxes) to the Level-0 folder ongl-processing. For example, for CH-CHA move files toZ:\CH-CHA_Chamau\20_ec_fluxes\2022\Level-0(gl-processing is mounted as drive Z in this example). - The RDS now has access to the database. This means that we now have a shared working environment where we can run Jupyter notebooks.
- FluxCoffee: separate meetings to discuss data related issues, e.g. flux processing, started and will continue to take place.
- List of QA/QC Meeting dates: QA/QC Meetings 2023
Participants
LH, LK, FT, KMK, SO (5)
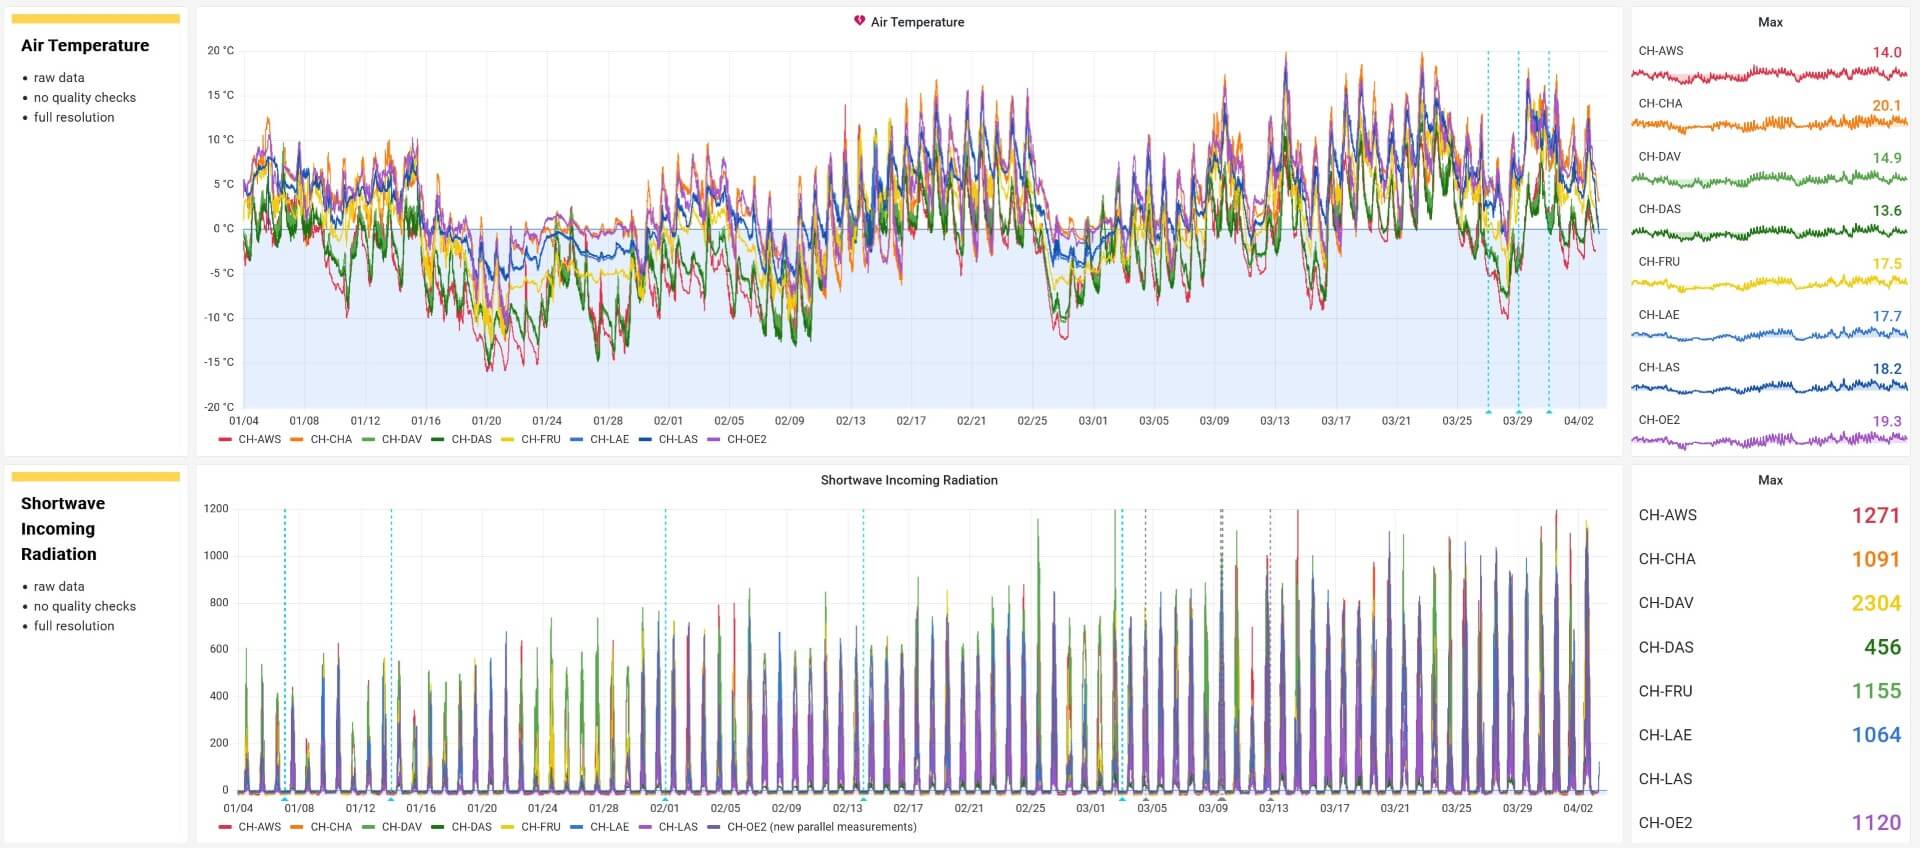
Recent Meteo Data
Grafana allows us to check meteo data from multiple stations in one plot. Both SW_IN and TA are very important variables, make sure to check them regularly.
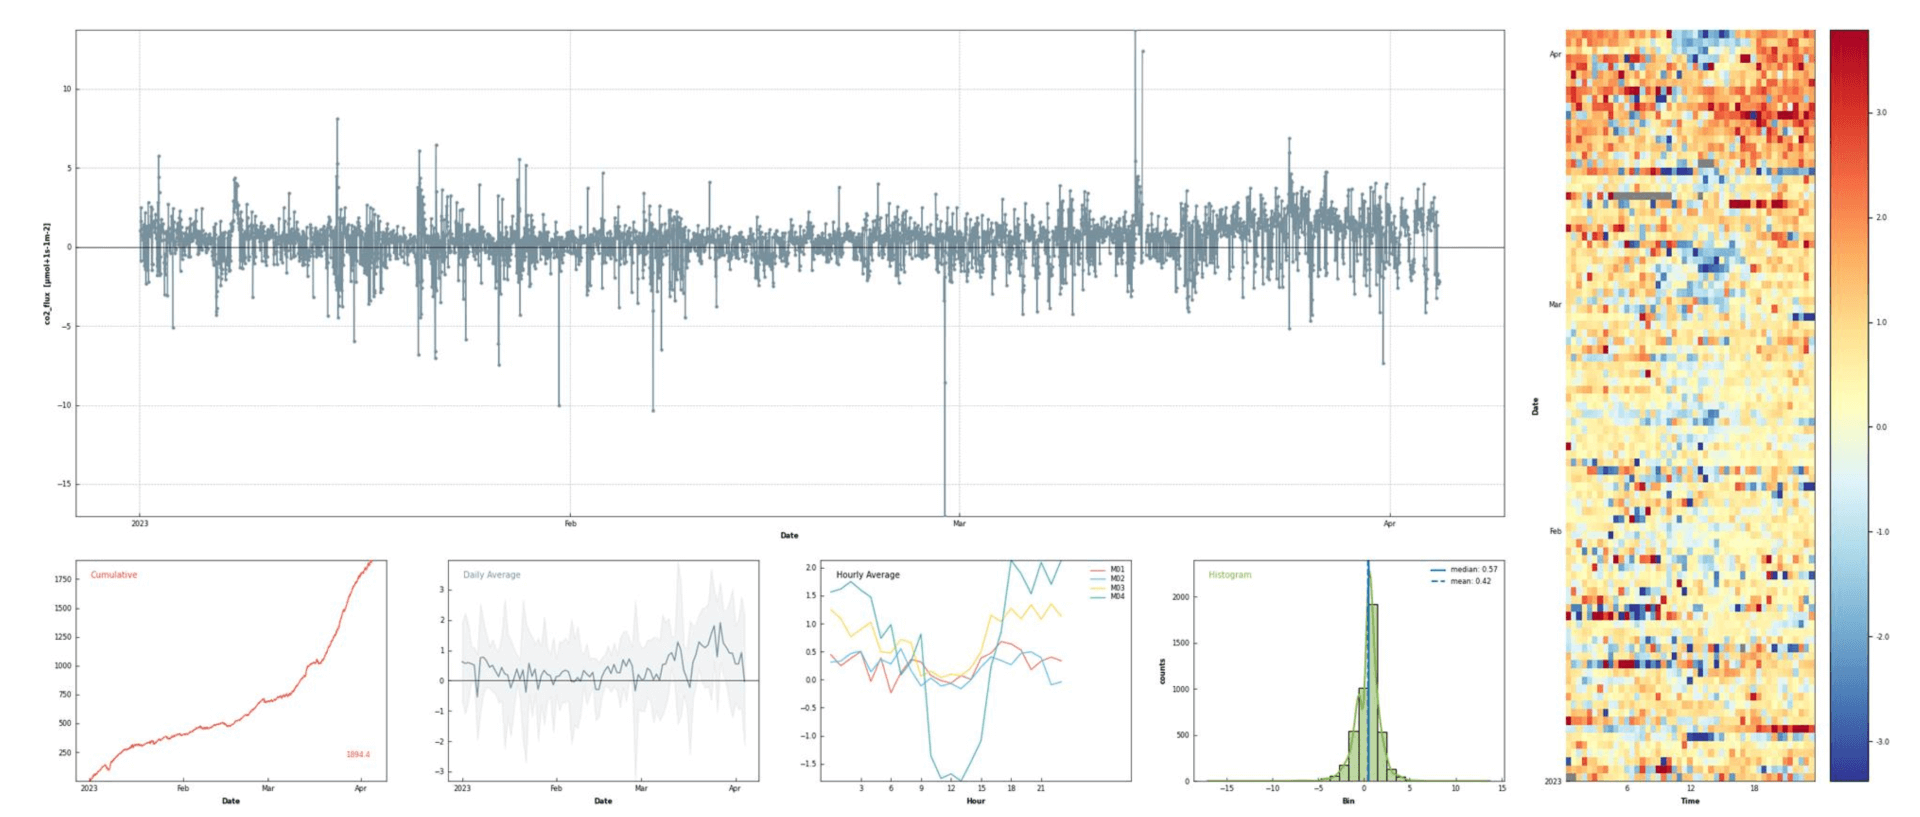
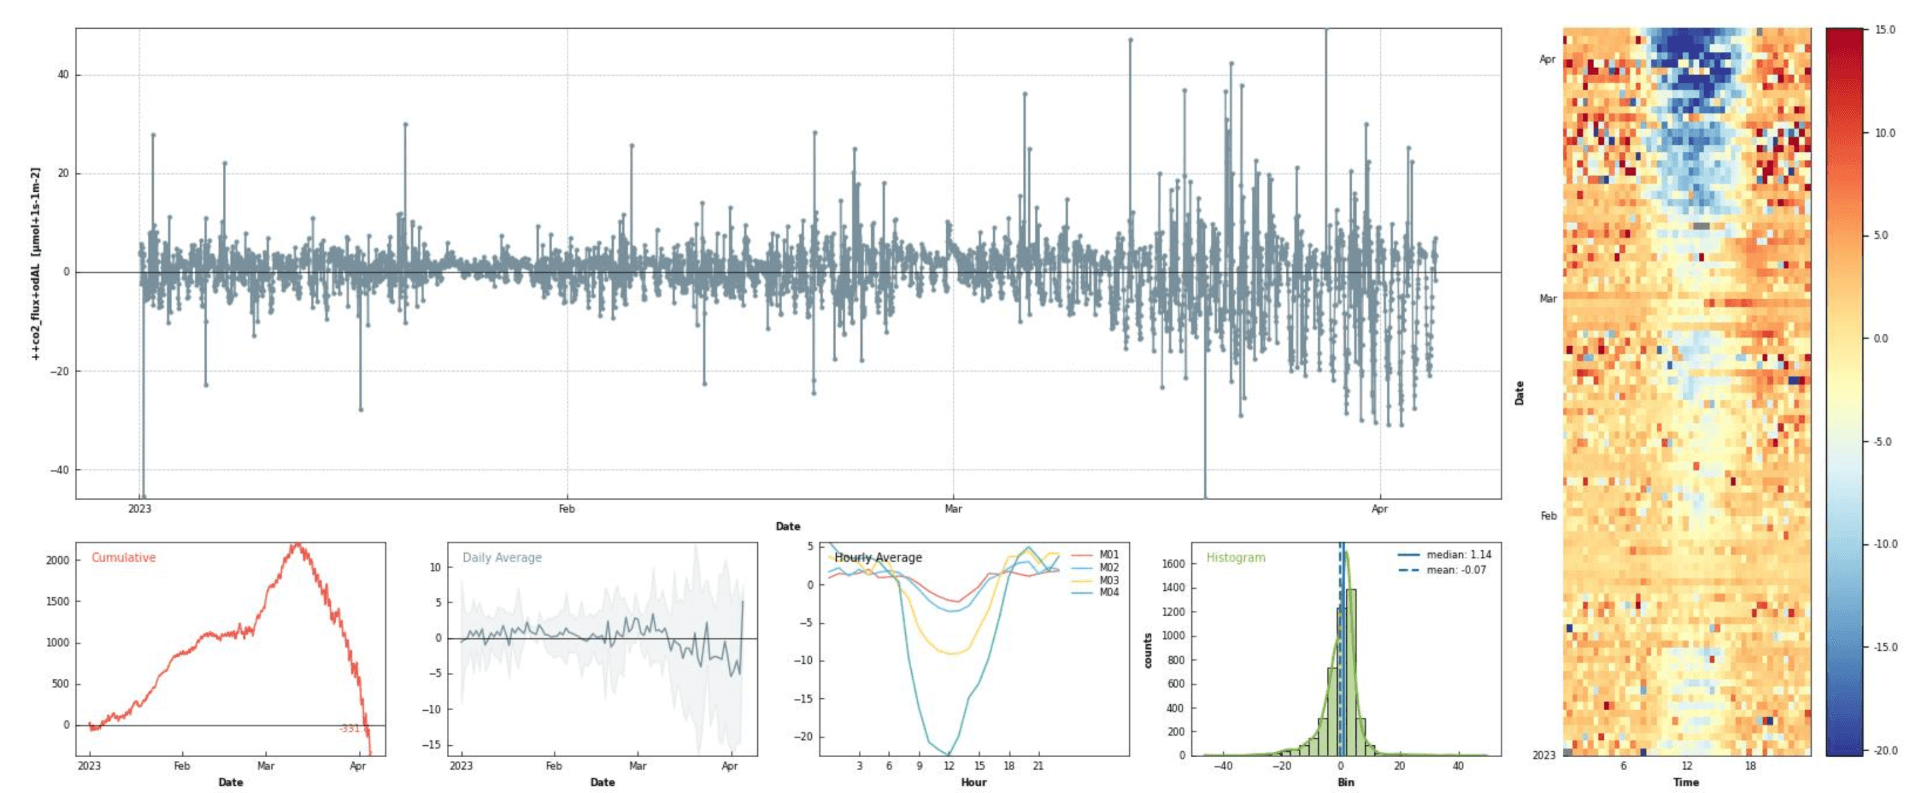
Recent CO2 Fluxes
CH-AWS
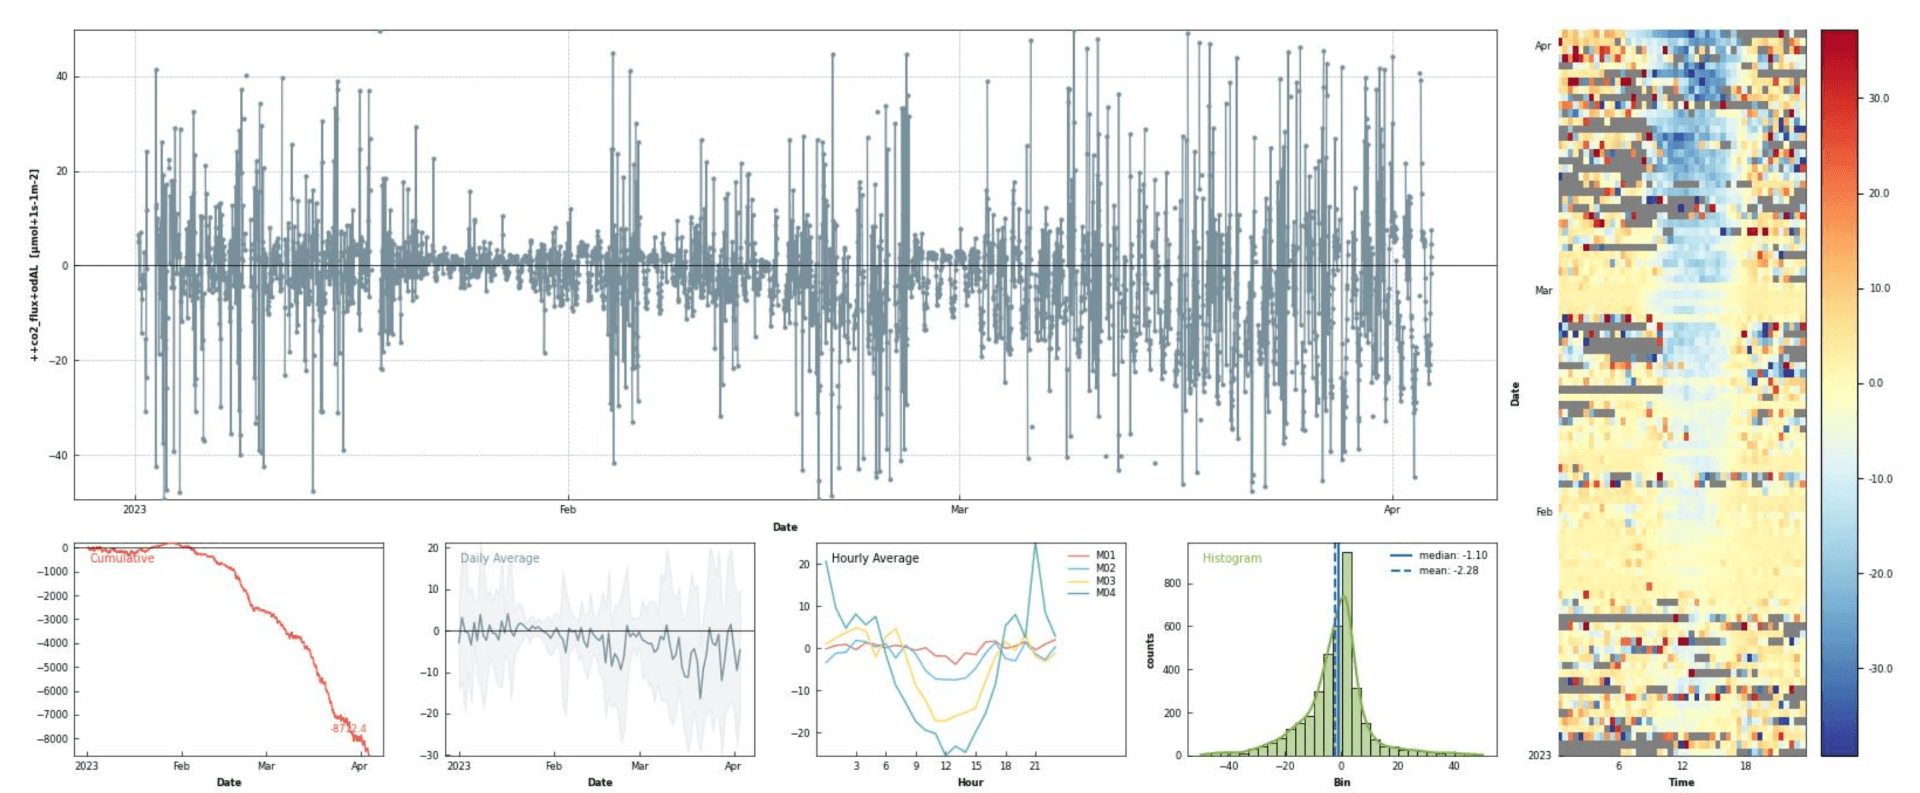
CH-CHA
Fertilization with slurry on 21 March, and herbicide (against blackheads) application on 28 March.
CH-DAV
CH-DAS
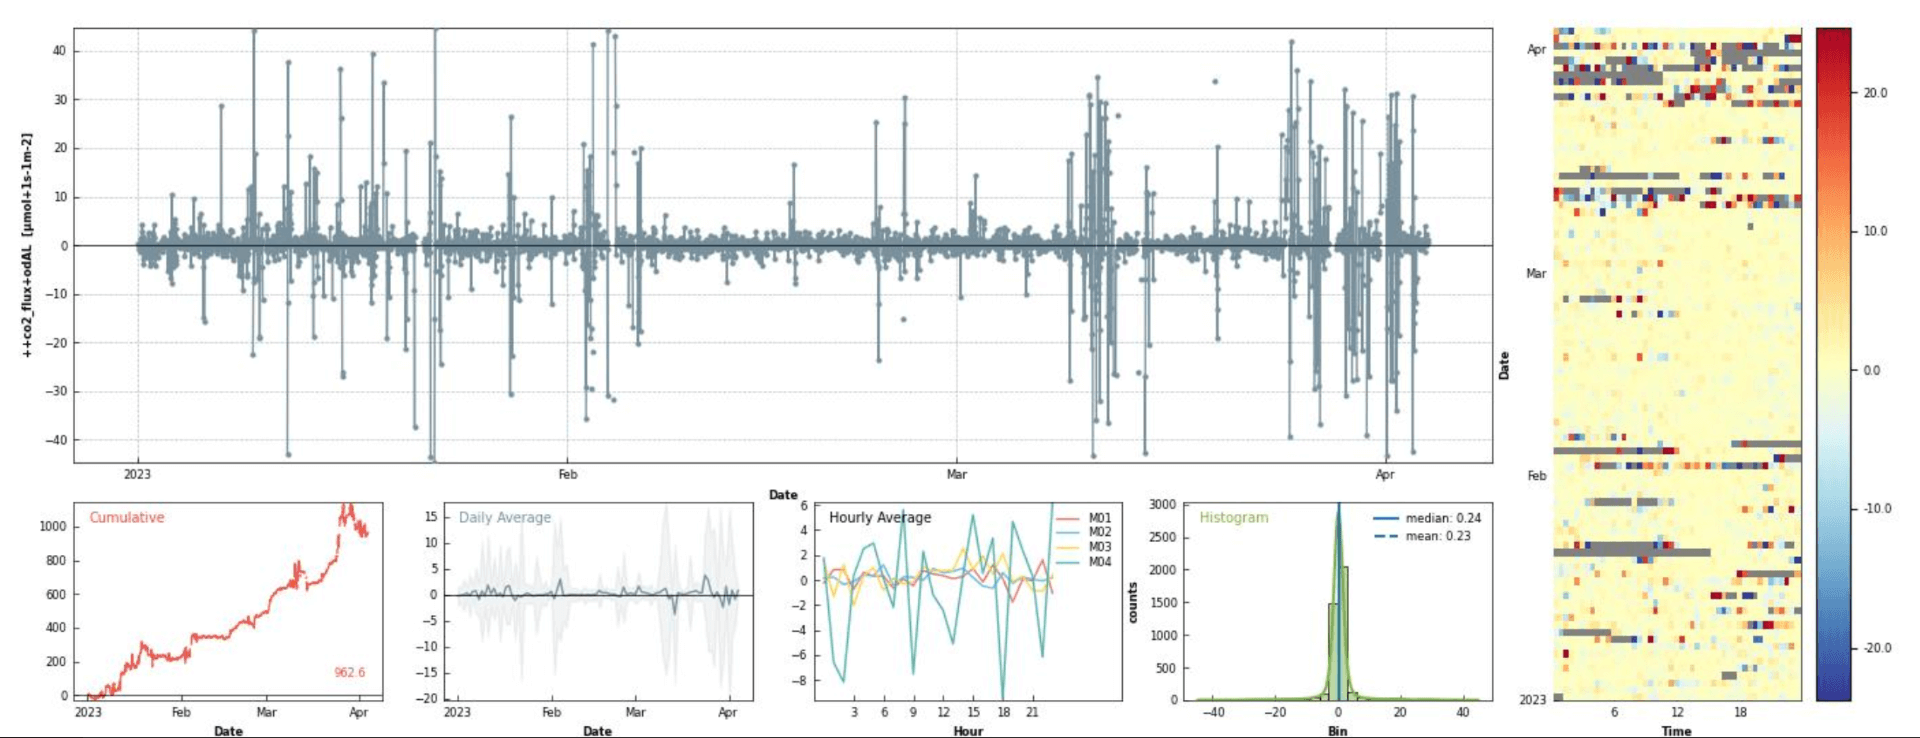
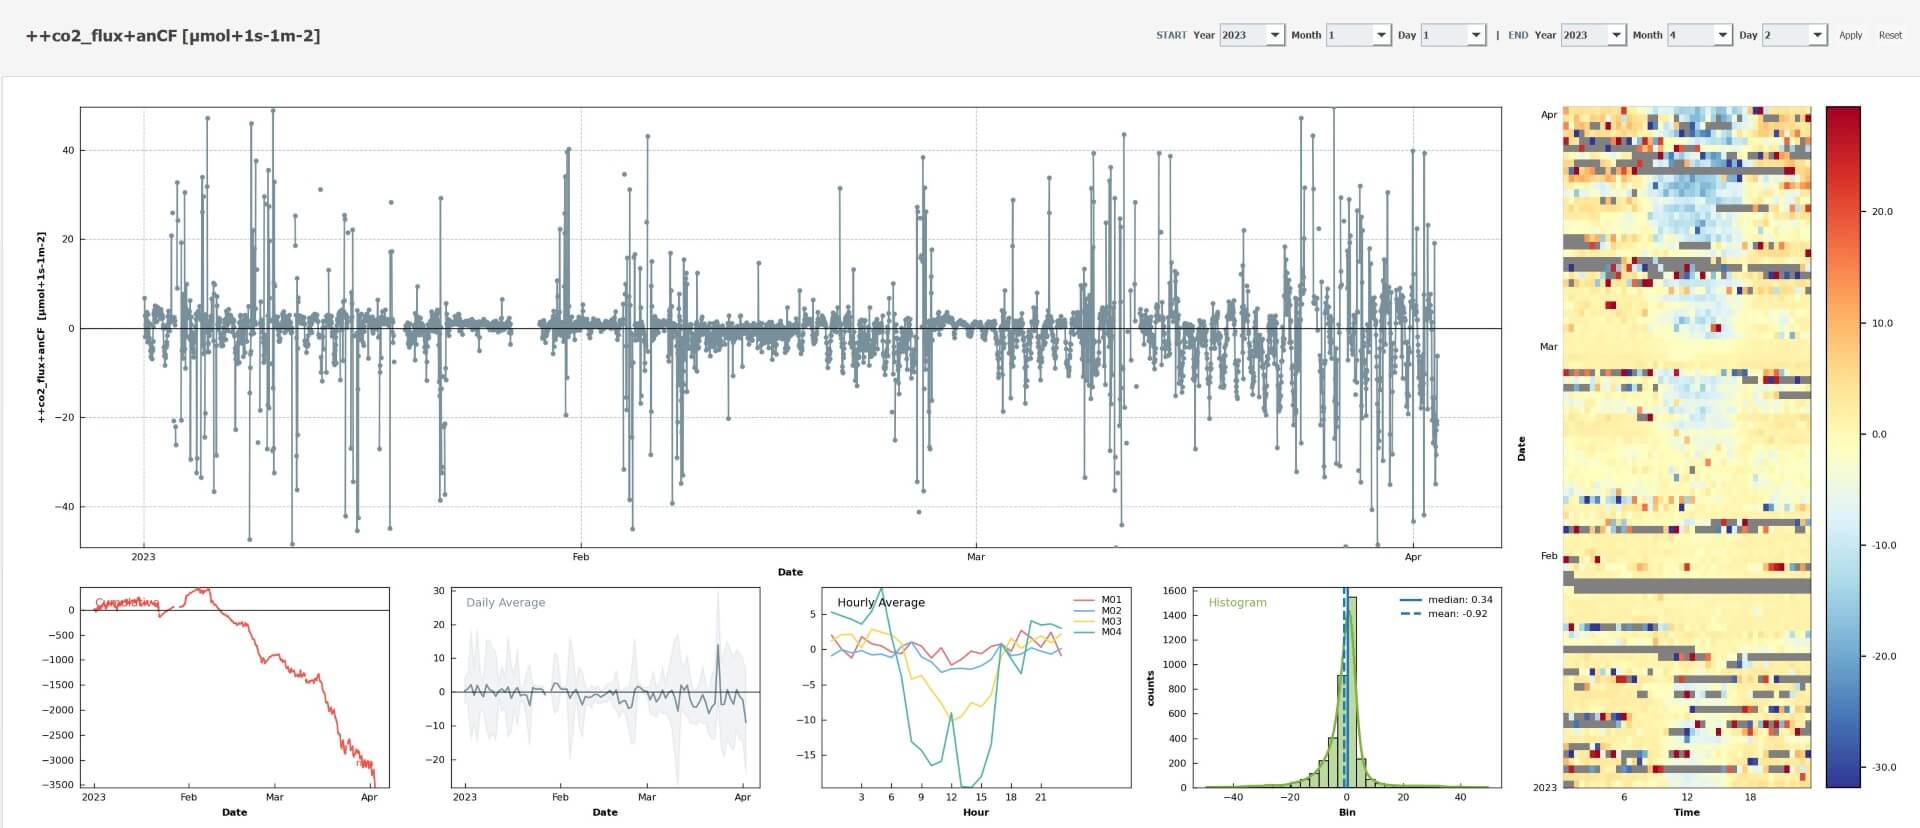
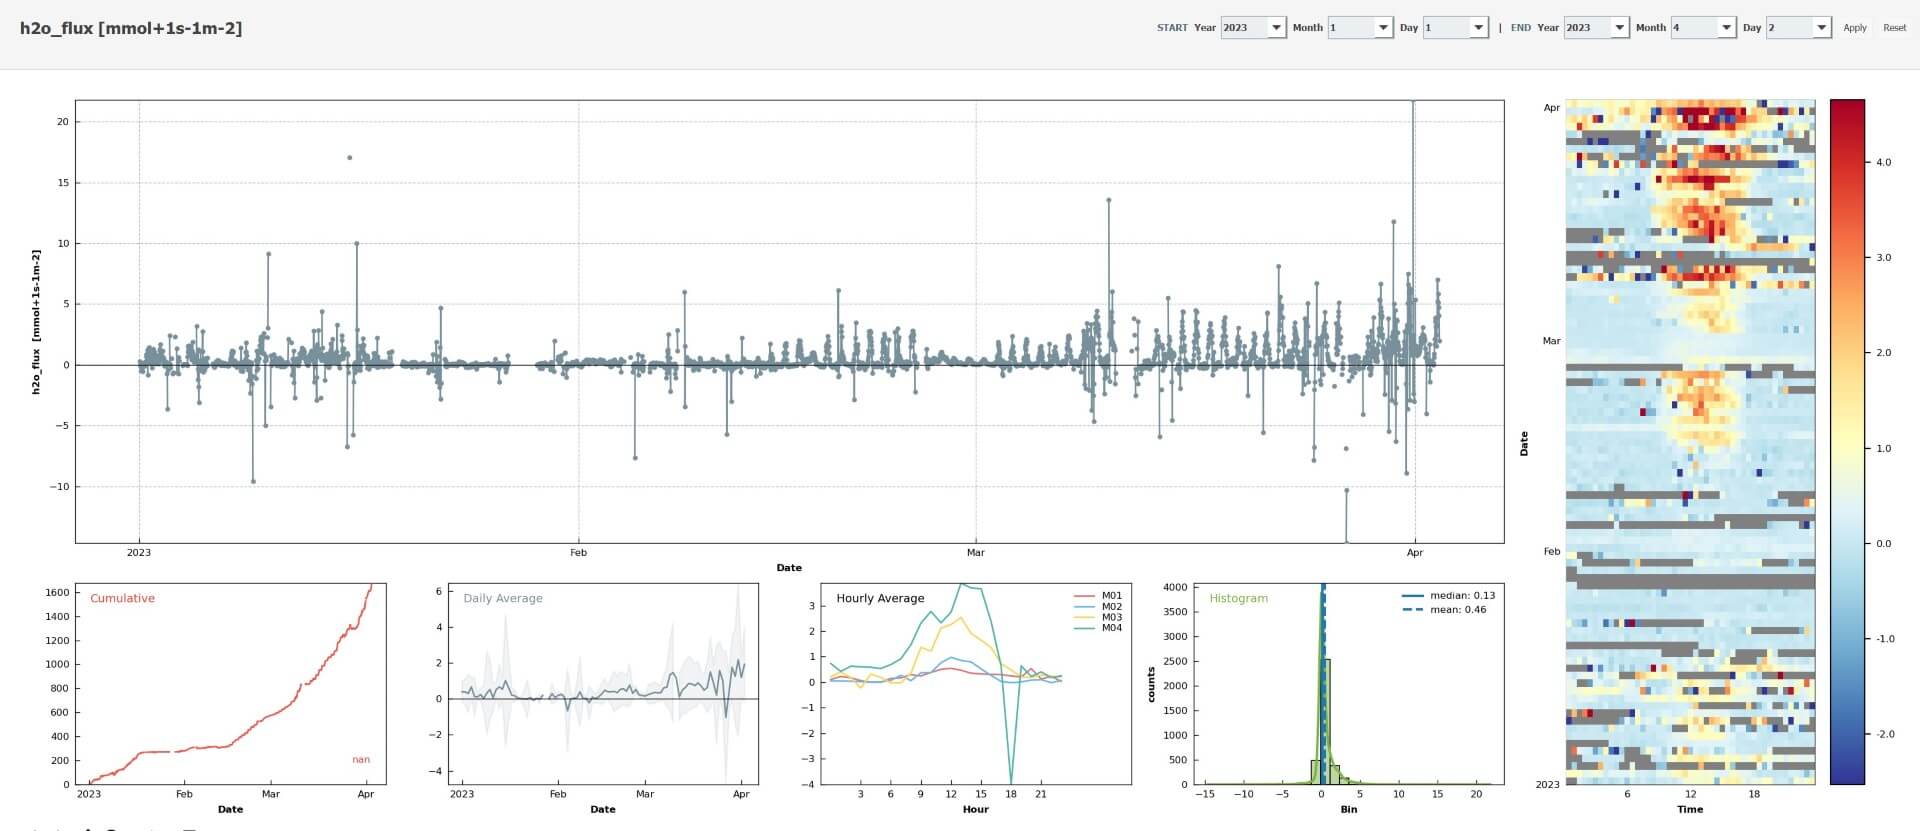
CH-FRU
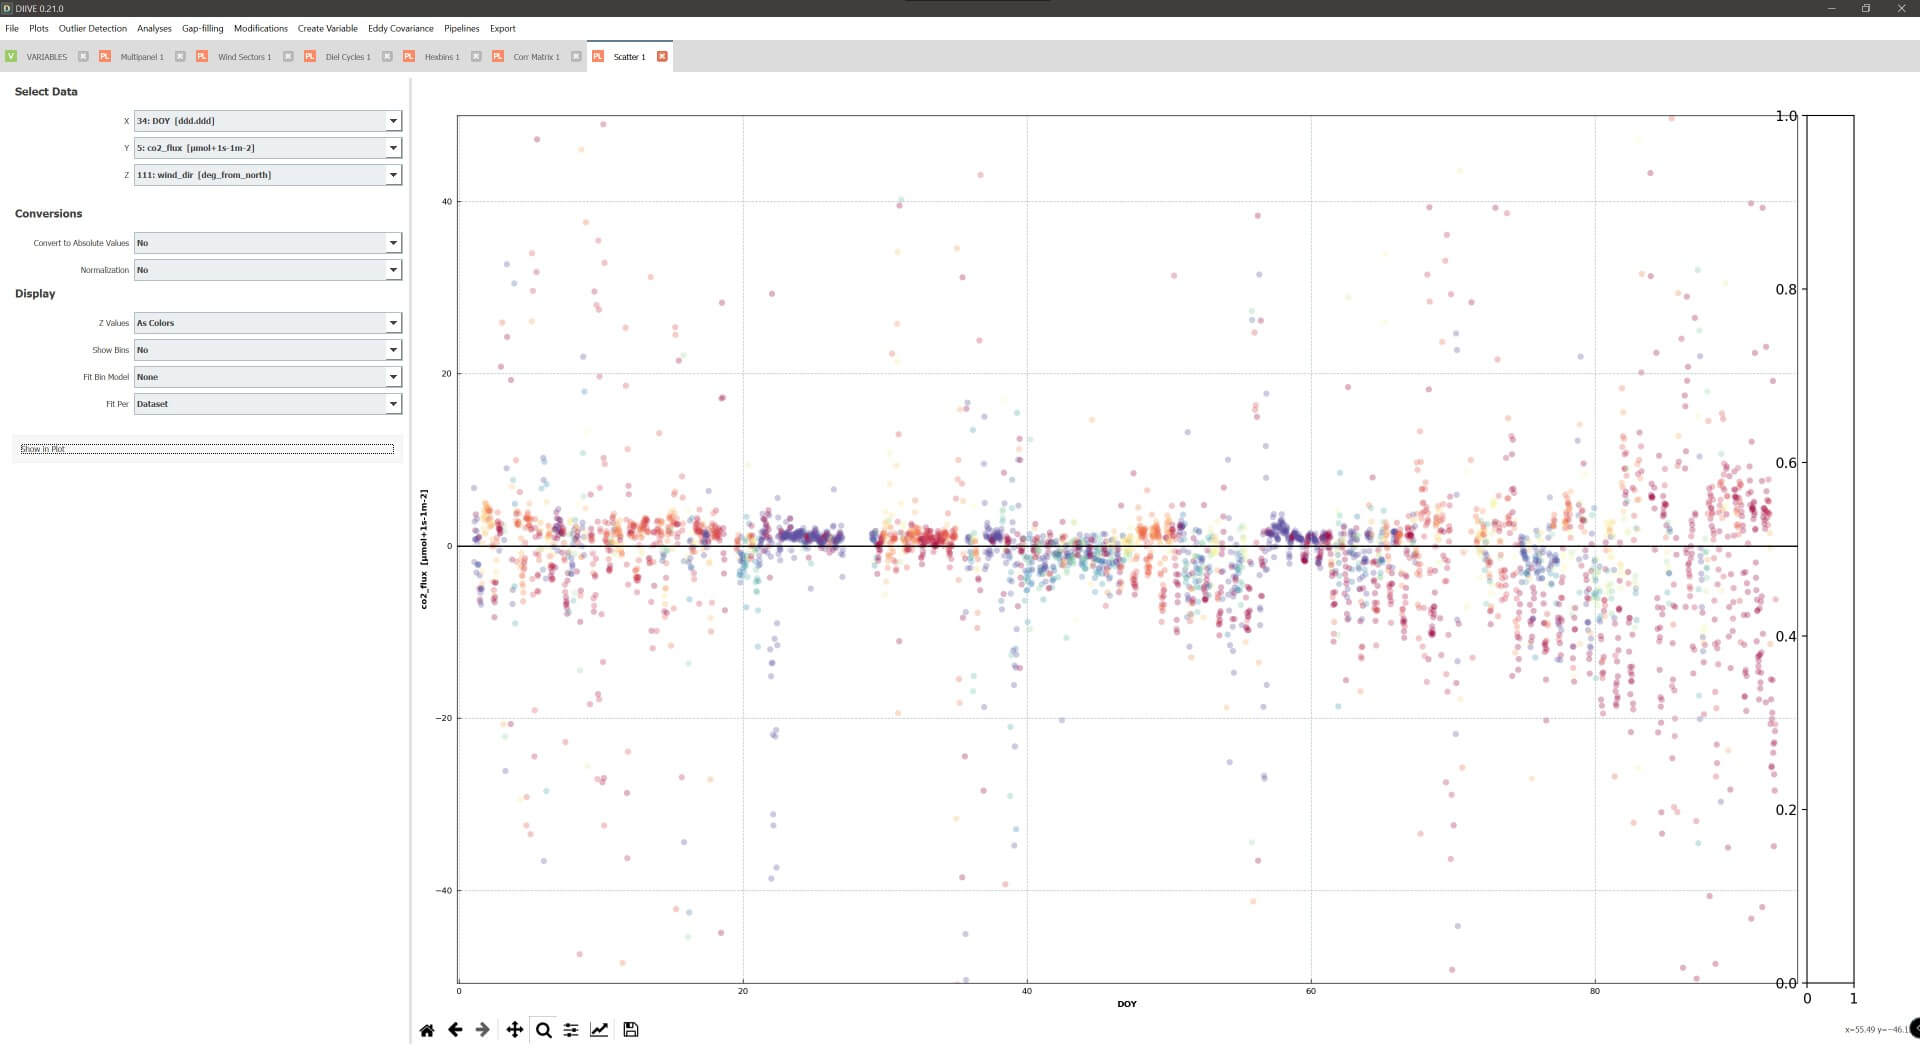
The CO2 flux this year so far. The colors represent the wind direction at the time of the respective flux value. Unfortunately the legend for the colors is missing, but generally purple are smaller values, and red are larger values. So the sequence is approx. purple < blue < green < yellow < orange < red, but please don’t quote me on that.
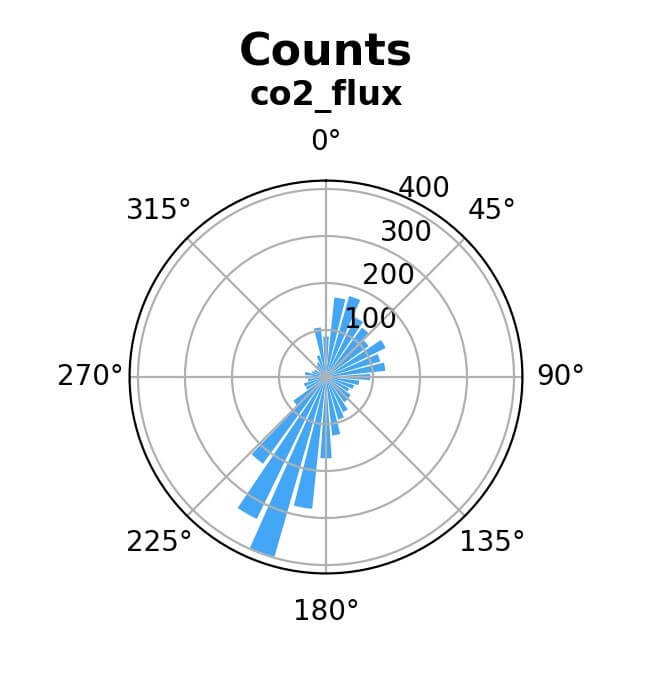
This plot shows how many CO2 flux values originate from which wind direction.
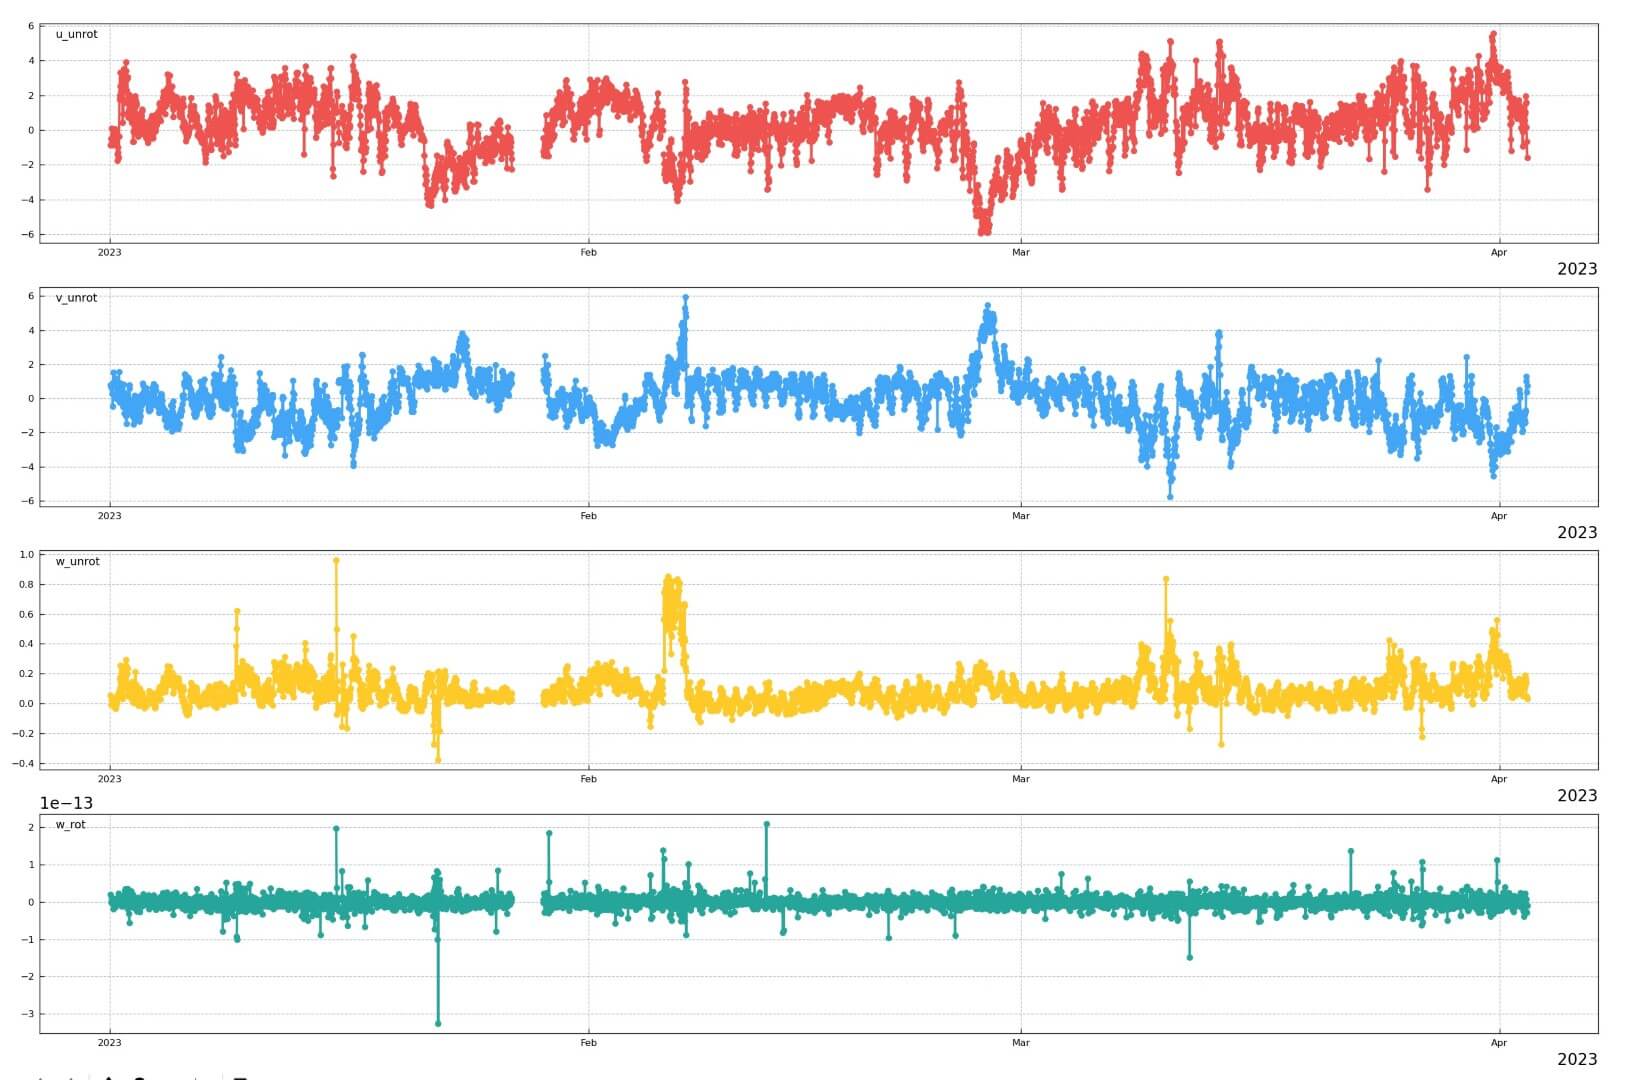
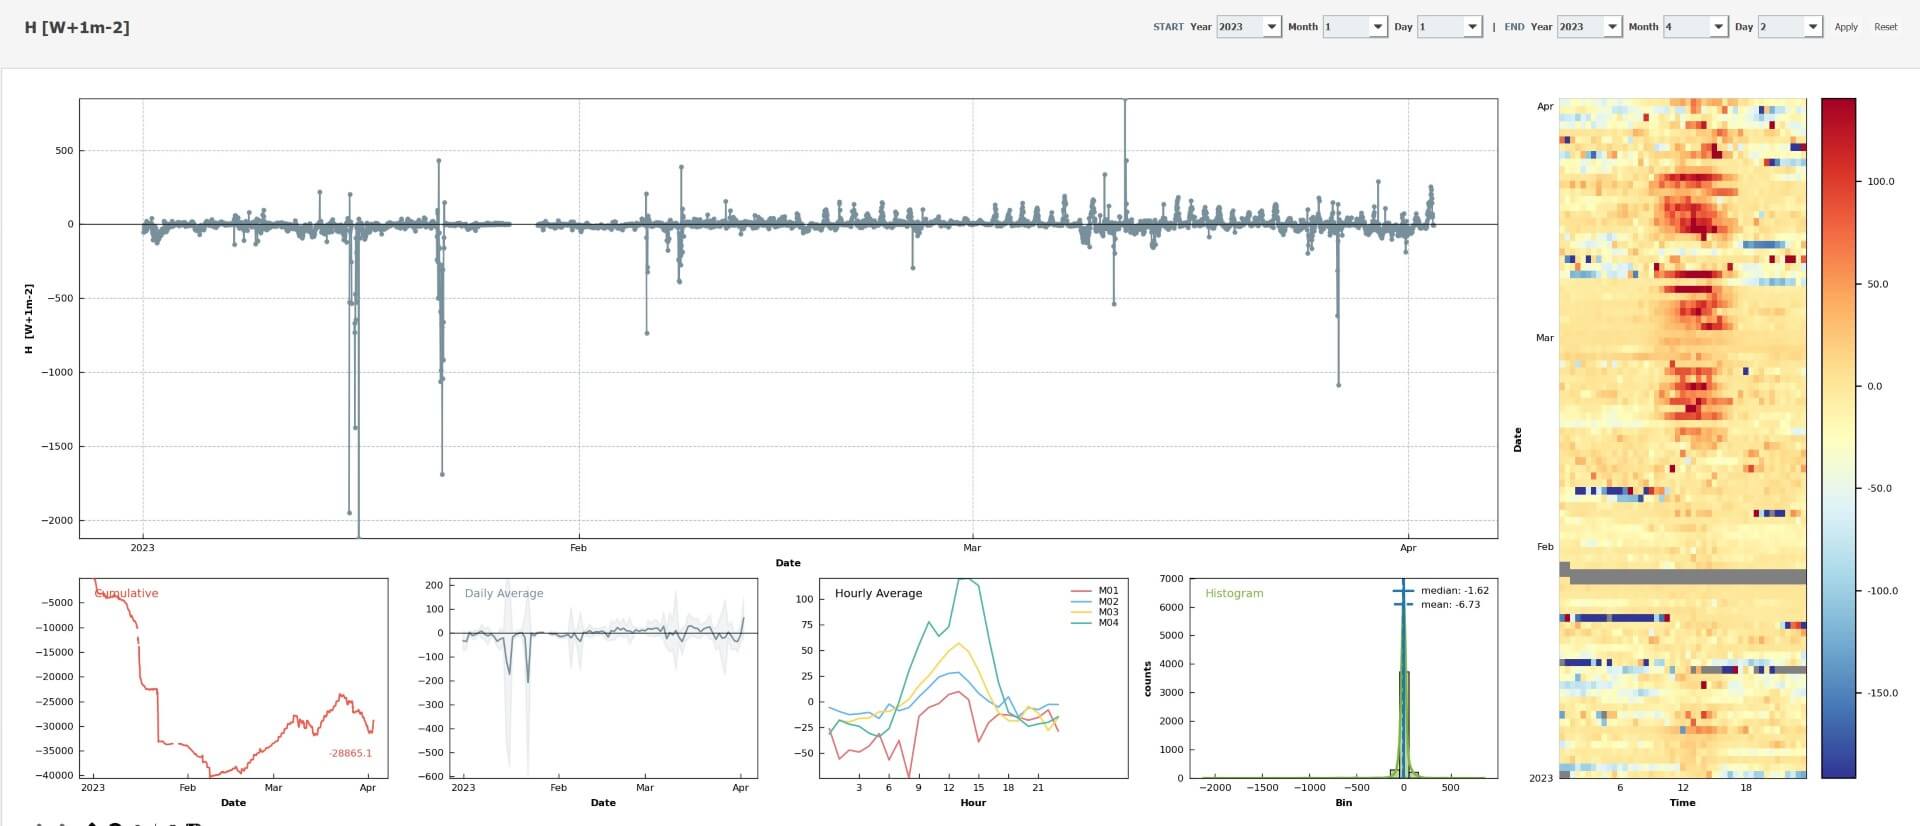
The three unrotated wind components u, v and w. Also shown is the rotated w, which must be very close to zero. w_rot is essential in calculating fluxes.
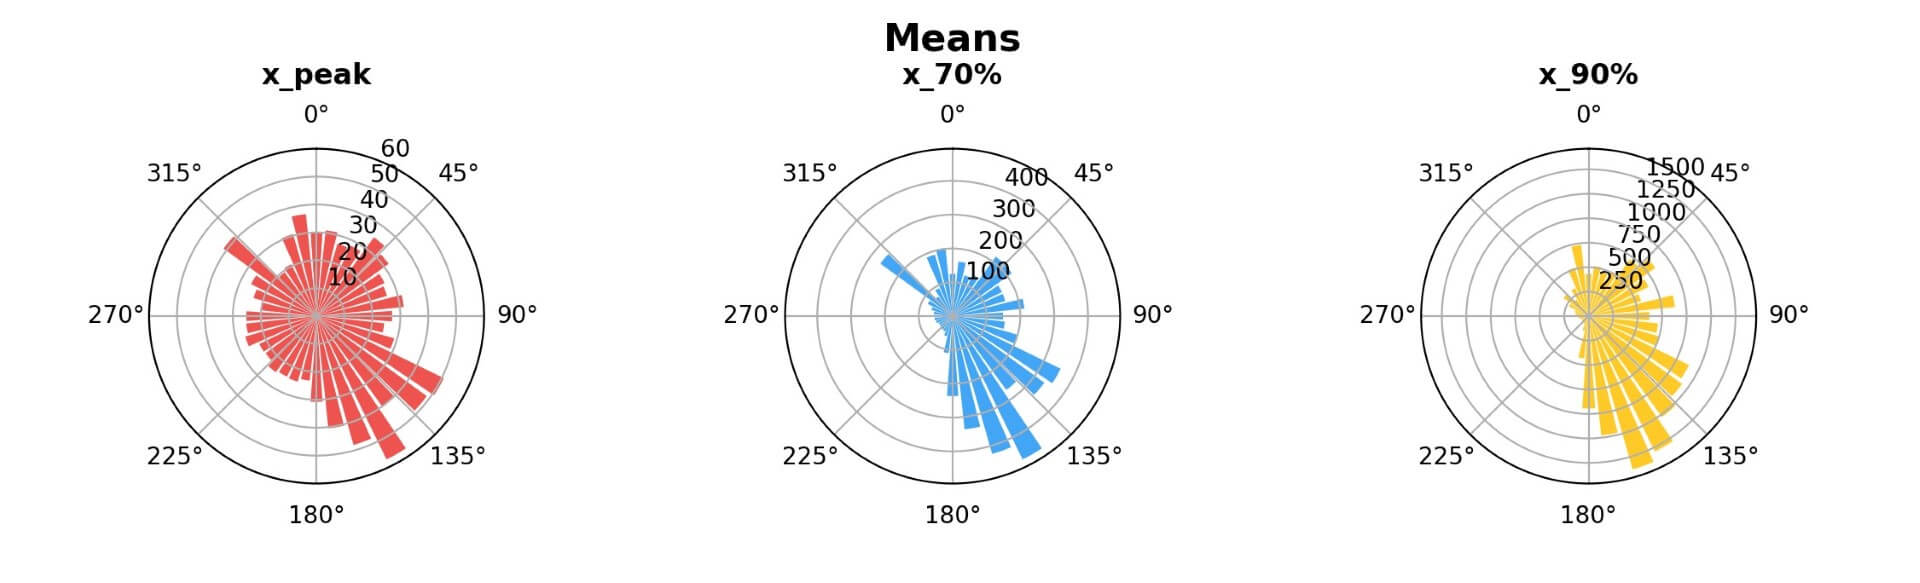
The footprint area is considerably larger when the wind does not come from one of the main wind directions.
CH-LAE
–
CH-LAS
–
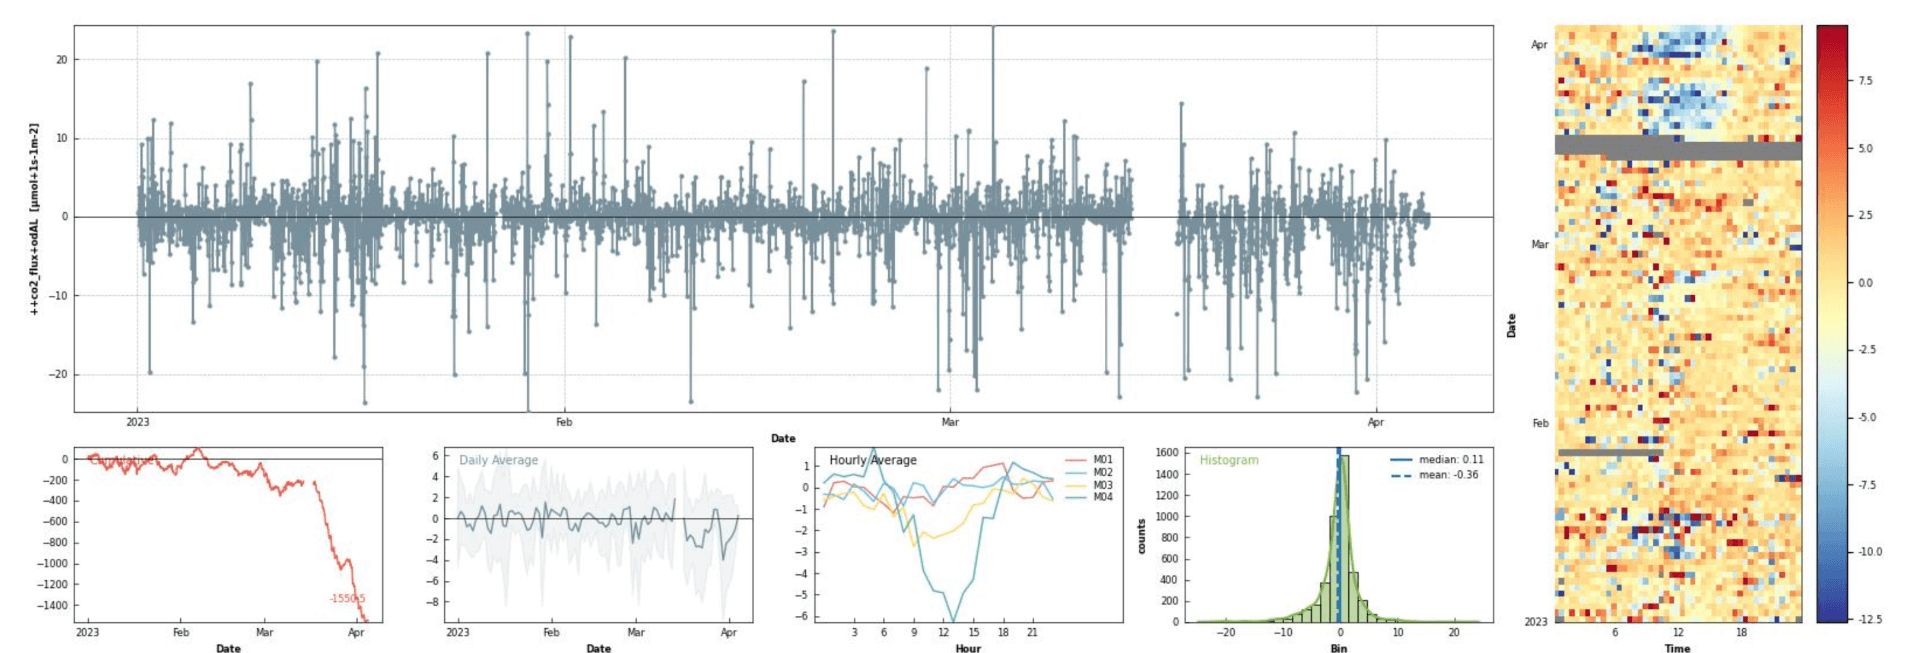
CH-OE2
Winter wheat. Mineral fertilization on 27.02, slurry application on 28.02, and insecticide spraying on 22.03.
Last Updated on 8 Apr 2023 15:48