Short Report – QA/QC Meeting Sep 2022
Meeting Date: 8 Sep 2022
Talking Points
- Checking fluxes from CH-LAE during the heatwave campaign
- Checking recent fluxes from other stations
General Info
- If you are (Tech-)SRP, please attend QA/QC meetings or tell LH if you can’t, needed for planning of the meetings.
- SRP & Tech-SRP: please prepare short statement about your site and send to to LH (max. 2 sentences)
- The purpose of QA/QC meetings is to check on current, incoming data. SRPs choose specific issues we should look at together and discuss in the group. Fluxes are checked if the respective SRP wishes to do so.
- There is a list of known variable abbreviations that you can use in case you wonder what an abbreviation means: Variable Abbreviations
- Check of EC raw data files:
- Recommended check for SRPs and T-SRPS: take a look at EC raw data files and check if they look OK
- Current EC raw data files are automatically converted to ASCII each day (done by the Python script bico)
- Files and their plots can be found here, e.g. for CH-LAS:
gl-processing\CH-LAS_Lae-Subcanopy\20_ec_fluxes\2022\raw_data_ascii
- Weekly flux calculations on the RDS:
- Please calculate fluxes and check them once per week, or more often if you wish to do so.
- If you cannot calculate the fluxes, try to find a substitute, e.g. LH.
- Please move your Level-0 results from the RDS to the respective Level-0 folder.
- Automatic upload of Level-0 fluxes to the database will be implemented soon.
- The folder
P:\Flux\RDS_calculationsis a temporary folder. Please move Level-0 flux calculations (preliminary fluxes) to the Level-0 folder ongl-processing. For example, for CH-CHA move files toZ:\CH-CHA_Chamau\20_ec_fluxes\2022\Level-0(gl-processing is mounted as drive Z in this example). - List of QA/QC Meeting dates: QA/QC Meetings 2022
Participants
LH, AS, LS, LK, YW, TB, SB, MS, SA, PM, AB, IF, FT (13)
Meteo Data
Grafana allows us to check meteo data from multiple stations in one plot. Both SW_IN and TA are very important variables, make sure to check them regularly.
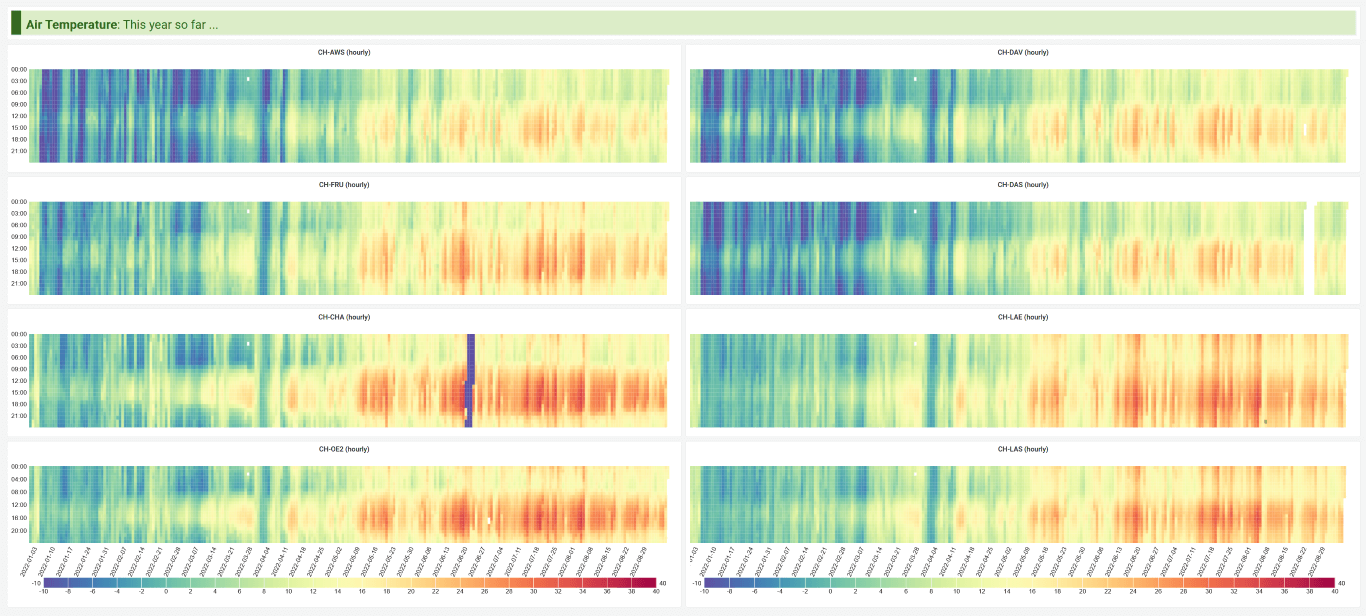
Air temperatures this year so far.
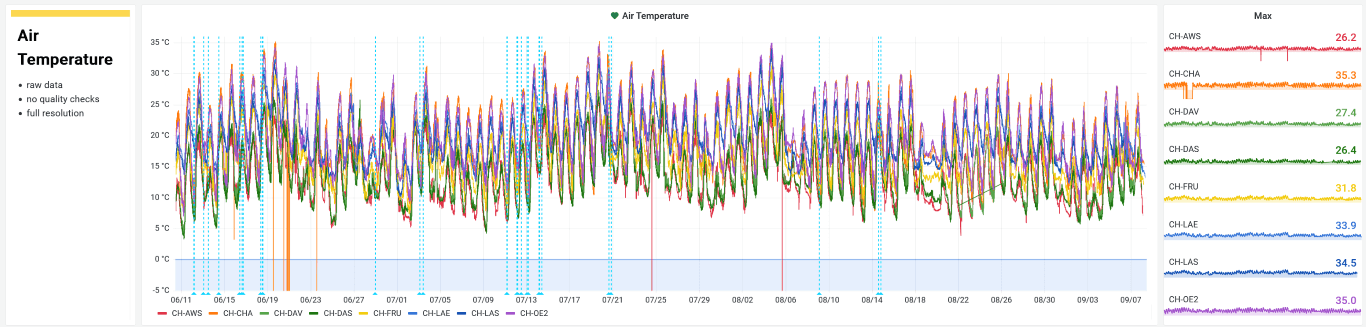
Air temperature (last 90d): The last months saw high air temperatures with maxima between 26.2 °C (CH-AWS) and 35.3 °C (CH-CHA).
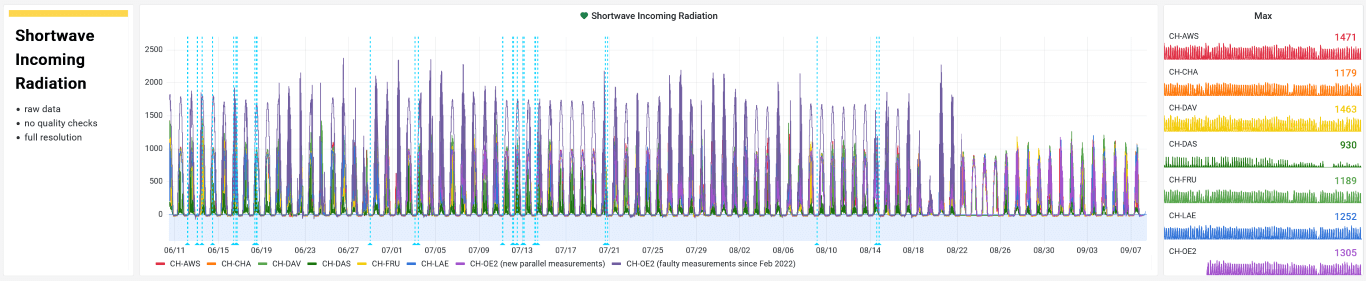
SW_IN (last 90d): Short-wave incoming radiation.
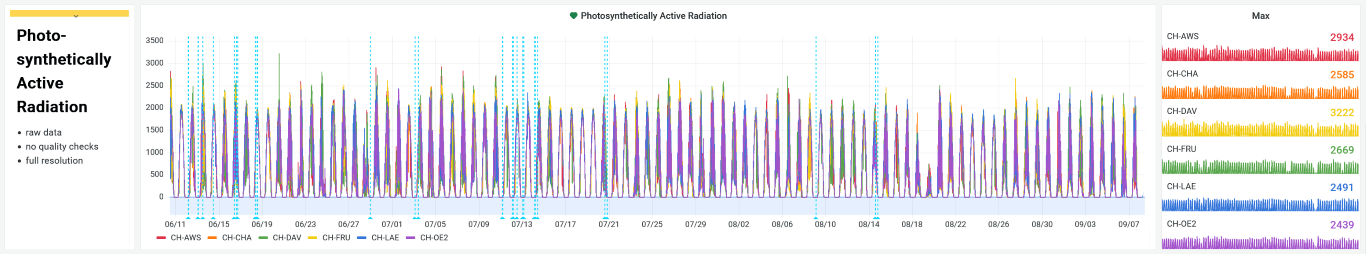
PPFD (last 90d)
Recent Fluxes
CH-AWS
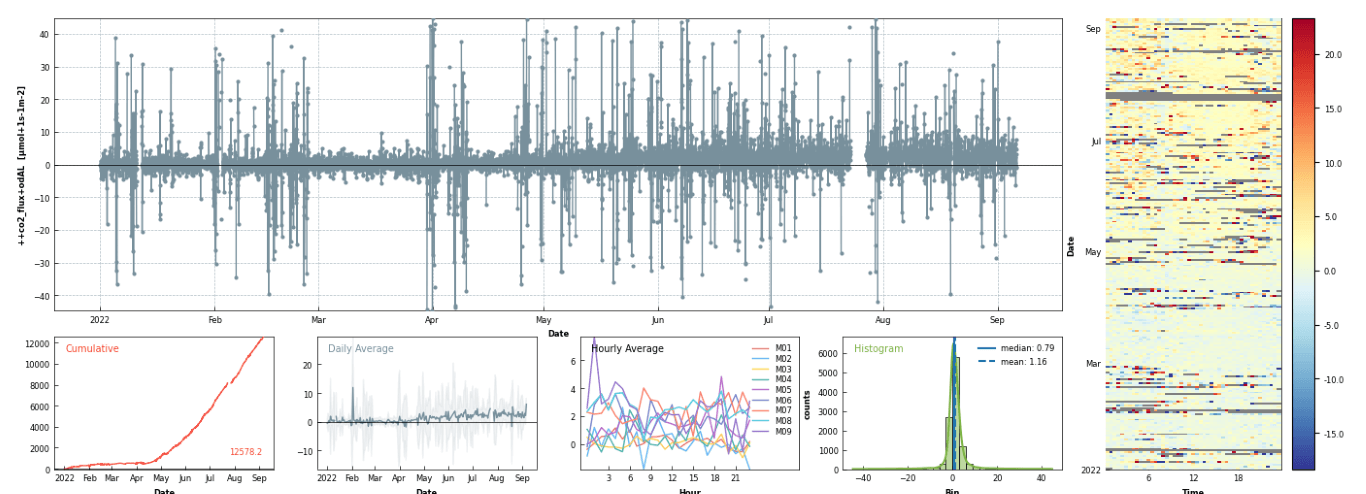
Short data gap in March due to software issues. CO2 uptake increasing until June, then mid-June becomes a CO2 source, probably due to grazing (and/or high air temperatures).
CO2 flux
CH-CHA
Very clear and consistent CO2 uptake since first day of the year. Fertilization on 14.3., rain on 15.3. (only rain event in March). N2O and CH4 fluxes nearly complete, only one 24h-gap so far this year. Very obvious sharp decrease of CO2 update after the mowing events. Four mowing events so far this year (May 10th, June 10th, July 6th, and Aug 9th). The QCL instrument for N2O and CH4 measurements was removed from the site in July. N2O emission peak around the July 1st.
CO2 flux
N2O flux: Same flux with three different color scalings.
CH-DAV
EC system runs well, but there was an issue with one of the sonic transducers (it popped out of the housing, found 9 Feb 2022, transducer was pushed back in), no issue visible in data. Sonic was replaced on 8 Mar 2022 (HS-100). CO2 uptake is consistently low for this time of the year. This summer was the hottest summer so far since 1997 (up until 11 Aug).
CO2 flux
CH-DAS
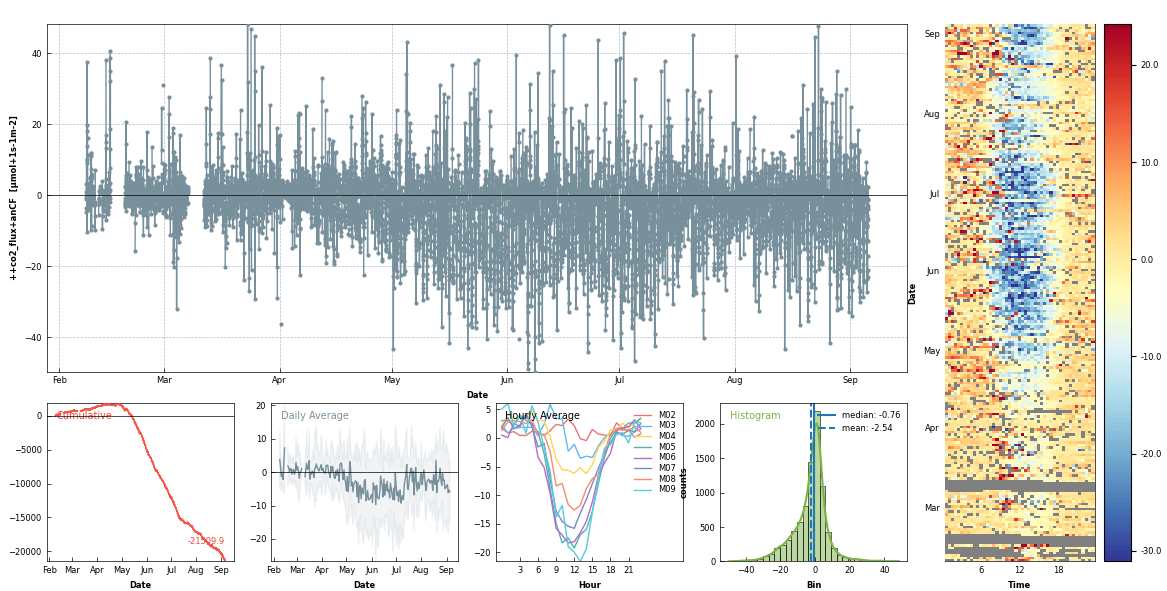
After snowmelt (in April?), clear net emission of CO2, see the red cumulative curve in the lower left corner of this plot:
CH-FRU
High CO2 uptake, few gaps. Harvest in June (not confirmed yet), approx. at the same time as the very hot day (19 June 2022). Harvests clearly visible.
CO2 flux
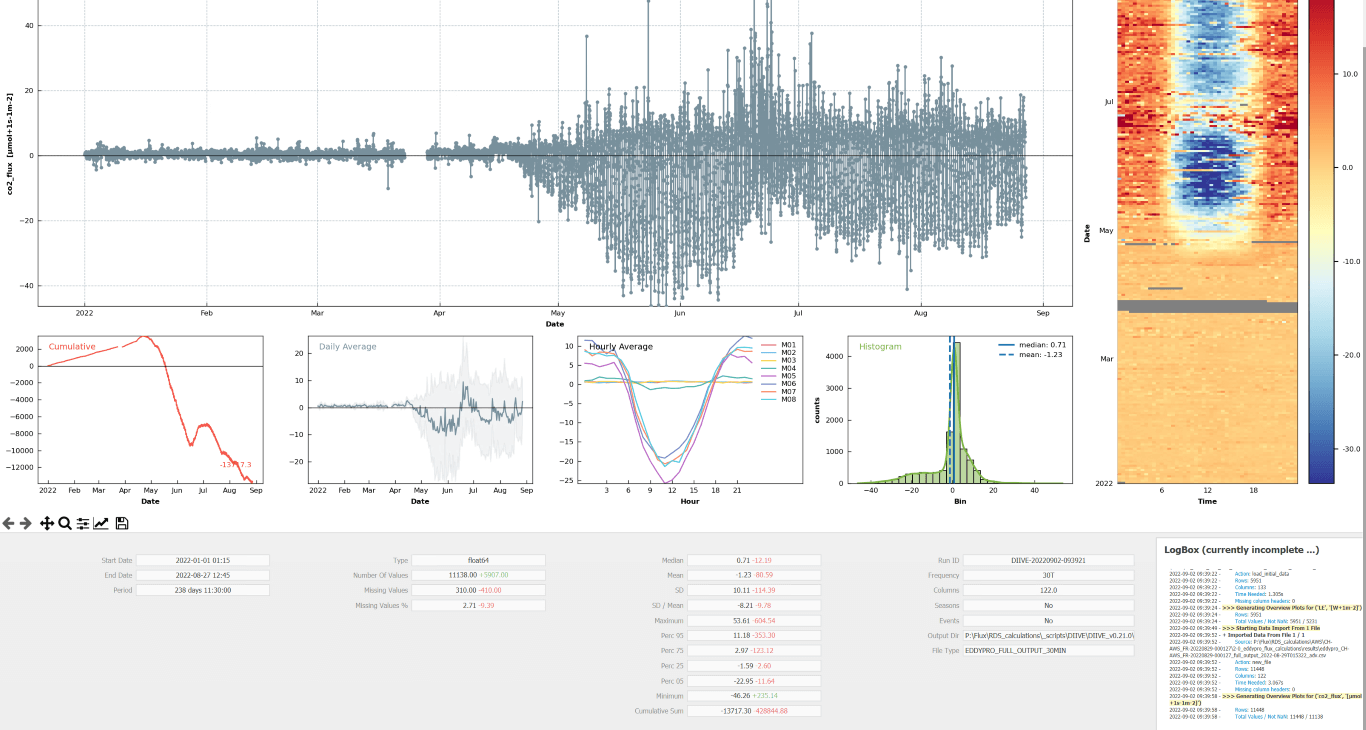
CH-LAE
Unknown data format between mid-December and start of February, we will try find out the format. Data gap in February due to calibration. An interesting phenomena was decrease in sensible heat in May as the energy was used more for latent heat. Strongly reduced CO2 uptake during the heatwave, clearly visible after mid-July.
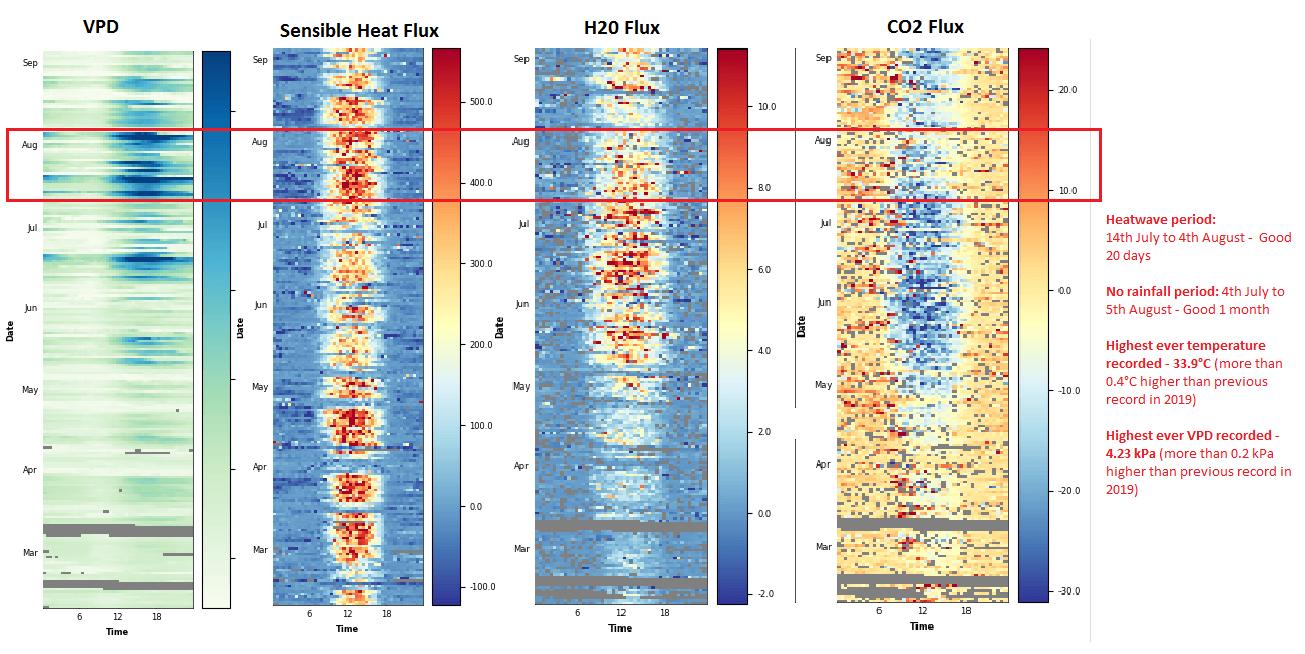
Fluxes and VPD. The red rectangle highlights the heatwave with record temperatures up to 33.9 °C. During the same time (and currently still ongoing) an intensive sampling campaign took place at the site
Strongly reduced CO2 uptake starting approx. mid-July during a period of high air temperatures, up to 33.9 °C (4 Aug).
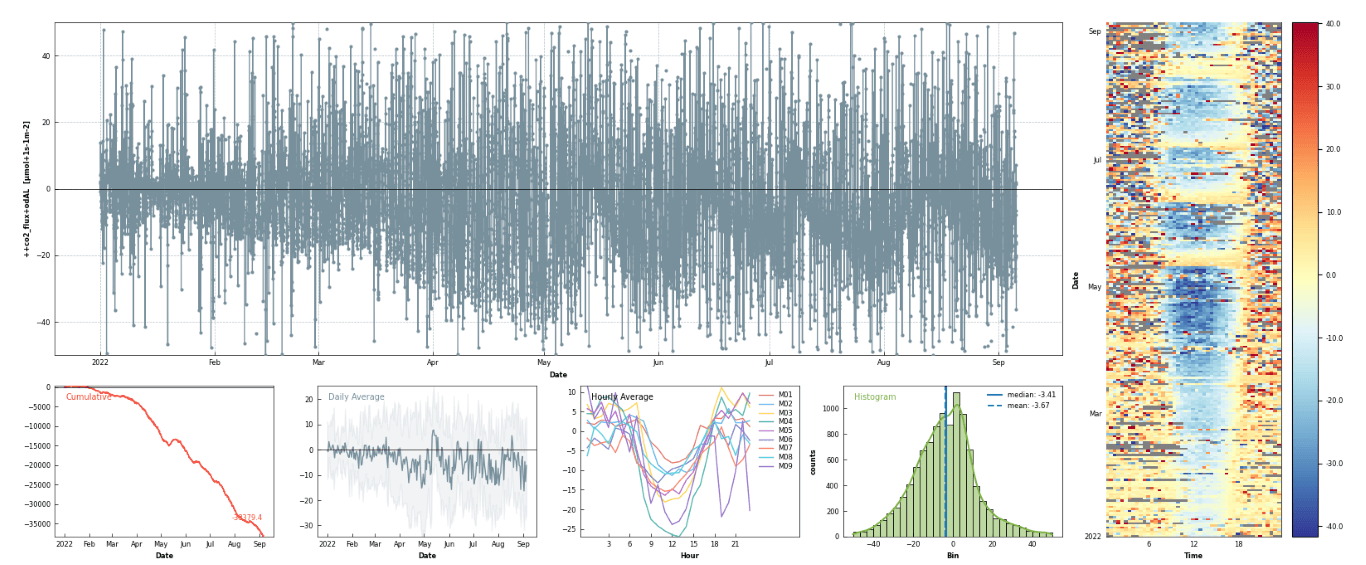
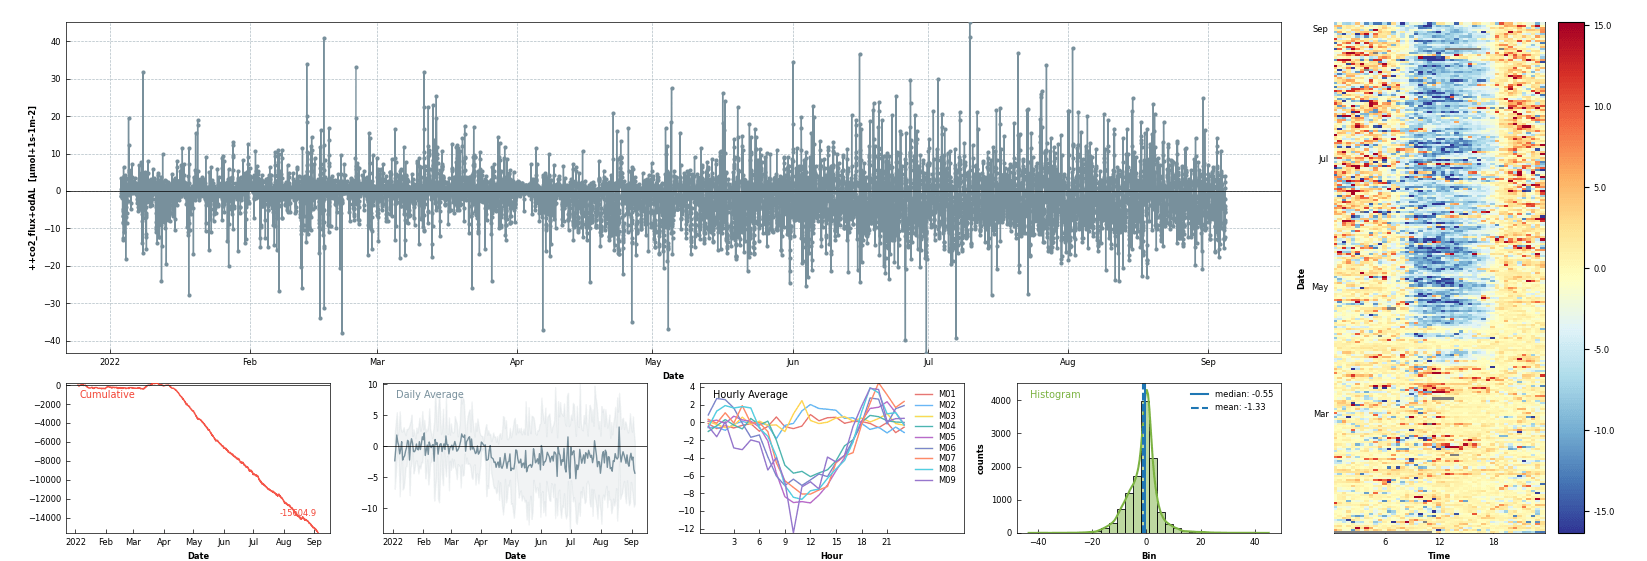
CH-LAS
CH-LAS recorded the highest VPD across all sites: 53.5 hPa on 4 Aug 2022.
End of April beginning of May the cumulative of CO2 over-passed the zero line, then there was a small pick of positive NEE (but we have some data gaps there) and after the NEE over-passed zero line again. As soon as the tree leaves came out in mid May the uptake of wild garlic decreased and the forest floor became a carbon source again.
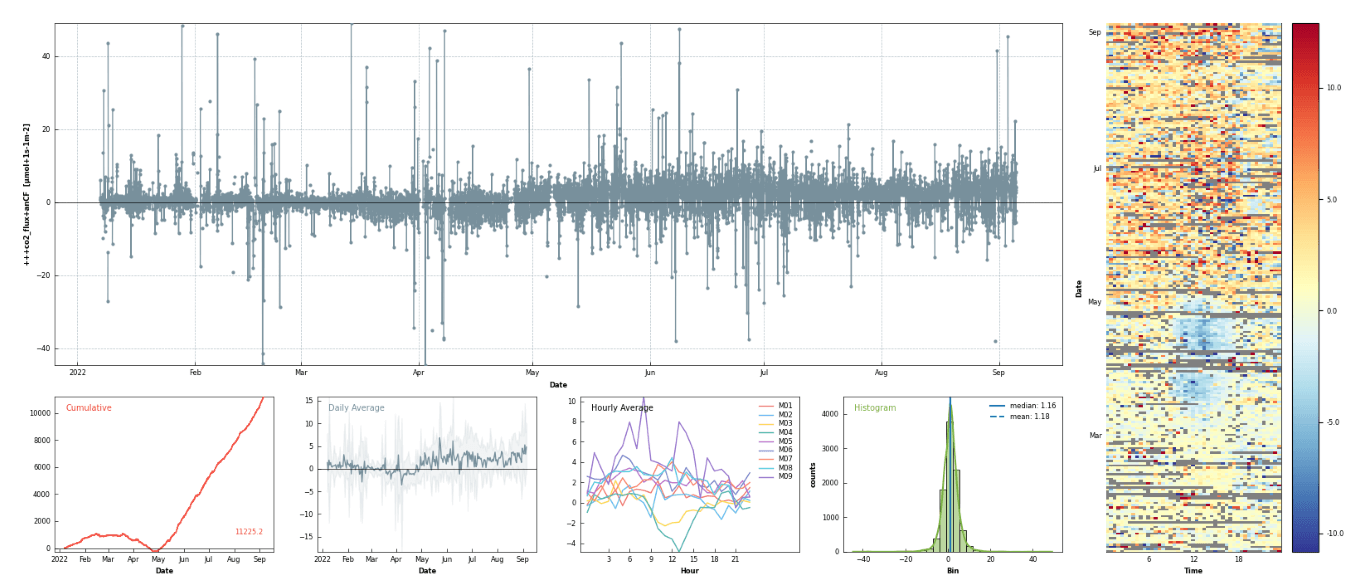
CO2 flux
CH-OE2
CH-OE2 is currently a temporary grassland. Already very clear CO2 uptake during the day since start of year. First cut of the temporary grassland on 14 May. Second cut of the grass on 25 June. Third cut on the 8 August. VPD was > 46 hPa over the summer.
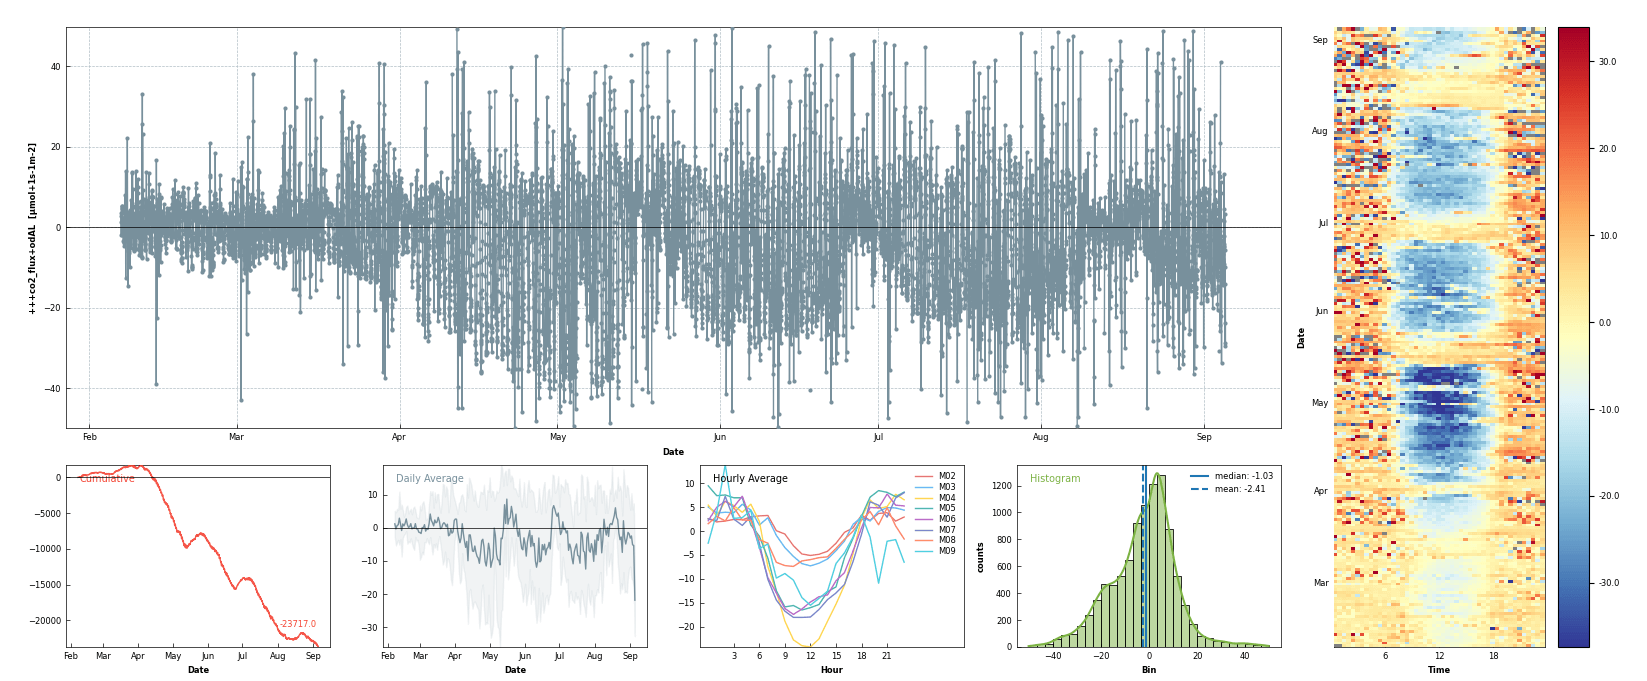
CO2 flux
Last Updated on 8 Sep 2022 13:19