CH-OE2, Oensingen
Contents
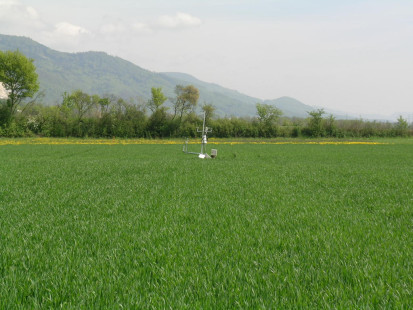
Site Description
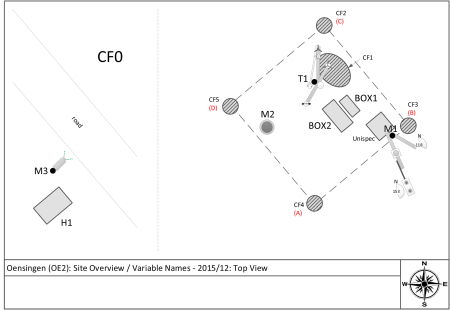
This site was part of the CarboEuropeIP project (EU FP6) and the GHG-Europe project (EU FP7). Eddy covariance flux measurements started in December 2003. The soil type is an eutri-stagnic cambisol. The site is located at 452 m and is managed as a typical intensive crop rotation under the Swiss Integrated Pest Management regime (IP Suisse). The tower coordinates are: 47°17’11.1″ N and 7°44’01.5″ E; WGS84 47.286417, 7.73375. During the CarboEuropeIP project, colleagues from Agroscope operated the Oensingen Grassland site nearby.
Location
- Altitude: 452 m a.s.l.
- Site name: Oensingen, Canton of Solothurn, Switzerland
- Land cover (IGBP land classification): Cropland
- Land use: Typical intensive crop rotation under the Swiss Integrated Pest Management regime (IP Suisse).
- Coordinates: 47°17’11.1″ N / 7°44’01.5″ E (47.286417, 7.733750) (Google Maps)
- Location description: Oensingen is located at the southern edge of the bottom of the Jura Mountains.
- FLUXNET ID: CH-Oe2 (link)
Climate
Nearby meteo stations
- Meteoswiss: Wynau (Google Maps) Data since: 1 Jan 1978 | 424 m a.s.l. | in 5 km distance
- Meteoswiss: Langenbruck (Google Maps) Data since: 1 May 1882 | 731 m a.s.l. | in 8 km distance
Vegetation
LAI
- DOWNLOAD: LAI data (2004-2020) CH-OE2_LAI_2004-2020.xlsx
Carbon and Nitrogen Content
| Date | crop variarity | organ | C% (g C per 100 g dry matter) | N% (g N per 100 g dry matter) | C/N ratio |
| 2004-08-03 | winter wheat | grain | 42.2 | 2.68 | 15.75 |
| straw | 44.1 | 0.23 | 191.74 | ||
| 2005-07-14 | winter barley | grain | 42.7 | 2.02 | 21.14 |
| straw | 45.8 | 0.58 | 78.97 |
Soil
- Geology: Alpine lime (50%), jurassic lime (15%), silicon dioxide (15%), conglomerates and crystalline rock (15%).
- Soil type: Eutri-stagnic cambisol (1)
- Soil texture: Silty clay
- Total organic C: 0.00307 kg C per kg soil
- Total organic N: 0.000269 kg N per kg soil
| Date | Horizon | Sand/silt/clay | pH_avg | pH_std | Soil bulk density_avg | Soil bulk density_std | Wilting point | Soil water saturation point | Field capacity |
| cm-cm | %/%/% | g/cm3 | g/cm3 | % vol | % vol | % vol | |||
| 2005 | 0-25 | 9.5/47.5/43 | 5.5 | 1.66 | |||||
| 2005 | 25-40 | 8.5/46.3/45.2 | 5.9 | 1.55 | |||||
| 2005 | 40-60 | 6.5/45.9/47.6 | 5.9 | ||||||
| 2005 | 60-70 | 6/41.6/52.4 | 5.9 | ||||||
| 2020 | 0-15 | 14/45.6/37.8 | 6.35 | 0.14 | 1.24 | 0.04 | 28.3 | 48.6 | 42.8 |
| 2020 | 15-30 | 13.1/45/39.4 | 6.39 | 0.22 | 1.37 | 0.02 | |||
| 2020 | 30-50 | 12.9/50.1/35.6 | 6.7 | 0.24 | 1.49 | 0.02 | |||
| 2020 | 50-70 | 22.7/38.4/37.6 | 6.69 | 0.15 | 1.55 | 0.03 |
References:
- 2005: Alaoui A, Goetz B (2008) Dye tracer and infiltration experiments to investigate macropore flow. Geoderma 144: 279-286
- 2020: external analysis, 10 soil cores for each depth for soil pH and texture, 6 soil cores (0-20 cm) for the hydraulic properties
Management
Detailed Management Info
- DOWNLOAD: Detailed management info (2003-2023) CH-OE2.Management.allyears_2003-2023_20240209.xlsx
Crop Rotation
Crop rotation since flux measurements started. The site is managed as a typical intensive crop rotation under the Swiss Integrated Pest Management regime (IP Suisse).
| Order | wdt_ID | Crop | Sowing | Harvest | Notes |
|---|---|---|---|---|---|
| 2003-1 | 1 | Winter Wheat | 16 Oct 2003 | 04 Aug 2004 | |
| 2004-1 | 2 | Winter Barley | 29 Sep 2004 | 14 Jul 2005 | |
| 2005-1 | 3 | Cover crop | 09 Aug 2005 | ||
| 2006-1 | 4 | Potato | 05 May 2006 | ||
| 2006-2 | 5 | Winter Wheat | 19 Oct 2006 | 15 Jul 2007 | |
| 2007-1 | 6 | Winter Rapeseed | 28 Aug 2007 | 16 Jul 2008 | |
| 2008-1 | 7 | Winter Wheat | 07 Oct 2008 | 21 Jul 2009 | |
| 2009-1 | 8 | Cover crop | 12 Aug 2009 | ||
| 2010-1 | 9 | Peas | 09 May 2010 | 19 Jul 2010 | |
| 2010-2 | 10 | Winter Wheat | 15 Oct 2010 | 02 Aug 2011 | |
| 2011-1 | 11 | Winter Barley | 24 Sep 2011 | 09 Jul 2012 | |
| 2012-1 | 12 | Winter Rapeseed | 04 Sep 2012 | 28 Jul 2013 | |
| 2013-1 | 13 | Winter Wheat | 19 Oct 2013 | 24 Jul 2014 | |
| 2014-1 | 14 | Winter Barley | 29 Sep 2014 | 04 Jul 2015 | |
| 2015-1 | 15 | Cover crop | 03 Aug 2015 | ||
| 2016-1 | 16 | Peas | 09 May 2016 | 25 Jul 2016 | |
| 2017-1 | 17 | Winter Rapeseed | 30 Aug 2017 | 12 Jul 2018 | |
| 2018-1 | 18 | Winter Wheat | 11 Oct 2018 | 19 Jul 2019 | |
| 2016-2 | 22 | Winter Wheat | 12 Oct 2016 | 19 Jul 2017 | |
| 2019-1 | 23 | Winter Barley | 04 Oct 2019 | 01 Jul 2020 | |
| 2020-2 | 24 | Grass-Clover | 19 Aug 2020 | 19 Oct 2020 | |
| 2020-1 | 25 | Grass | 03 Apr 2020 | 19 Oct 2020 | (1) |
| 2021-1 | 26 | Grass-Clover | 30 May 2021 | ||
| 2021-2 | 27 | Grass-Clover | 20 Jul 2021 | ||
| 2021-3 | 28 | Grass-Clover | 02 Sep 2021 | ||
| 2021-4 | 29 | Grass-Clover | 18 Oct 2021 | ||
| 2022-1 | 30 | Grass-Clover | 14 May 2022 | ||
| 2022-2 | 31 | Grass-Clover | 25 Jun 2022 | ||
| 2022-3 | 32 | Grass-Clover | 08 Aug 2022 | ||
| 2022-4 | 33 | Grass-Clover | 20 Sep 2022 | ||
| 2022-5 | 34 | Winter Wheat | 06 Oct 2022 | 15 Jul 2023 | |
| 2023-1 | 35 | Cover crop | 27 Jul 2023 | 25 Sep 2023 | |
| 2023-2 | 36 | Winter Barley | 04 Oct 2023 | ||
| Order | Crop | Sowing | Harvest | Notes |
Notes
- (1) Grass was sown only on two bare soil patches, not on the whole fiel.
Cover Crops
- 12 Aug 2009: summer oat, phacelia, Alexandrine clover
- 3 Aug 2015: phacelia
Before Flux Measurements
- 1994 summer wheat
- 1994/1995 rapeseed
- 1995/1996 winter barley
- 1997 grassland
- 1998 grassland
- 1999 grassland
- 1999/2000 winter wheat
- 2001 potato
- 2002 cereal (not specified)
- 2002/2003 rape seed
Data
Current Flux Products
Available Level-1 Fluxes
- For info about the different flux levels, see Flux Processing Chain
Eddy covariance raw data files
- Overview of eddy covariance raw data files since 2003: EC Raw Binary Format (CH-OE2)
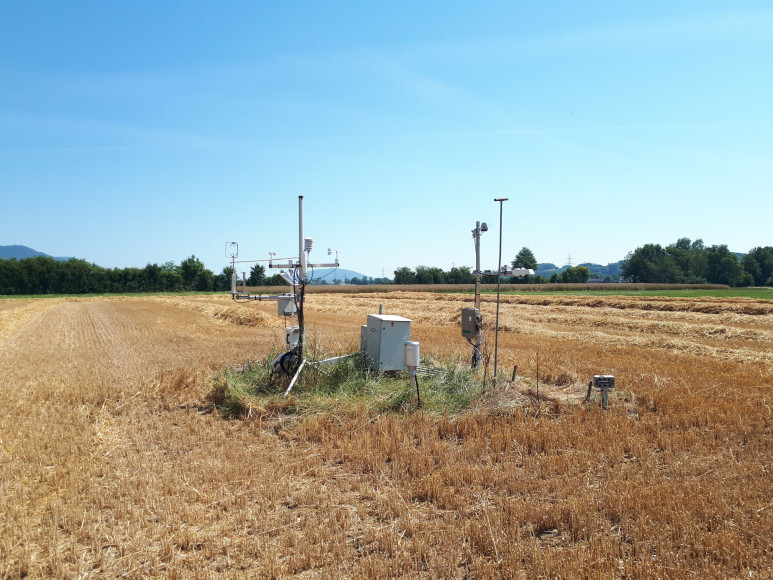
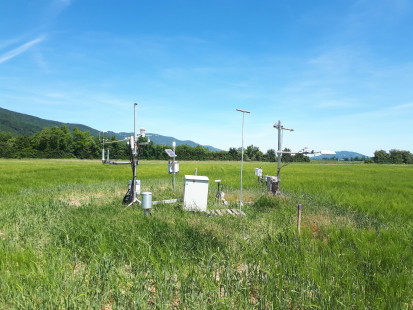
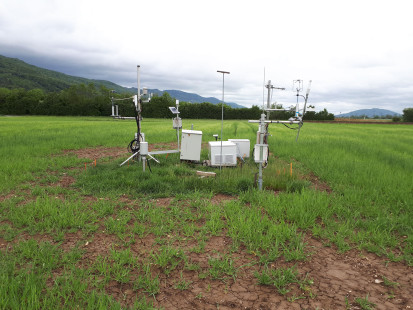
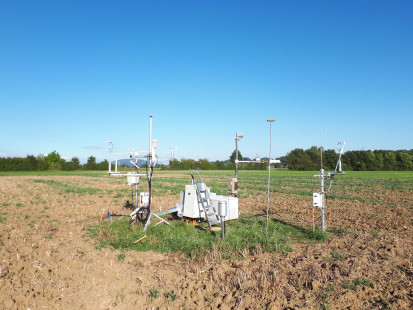
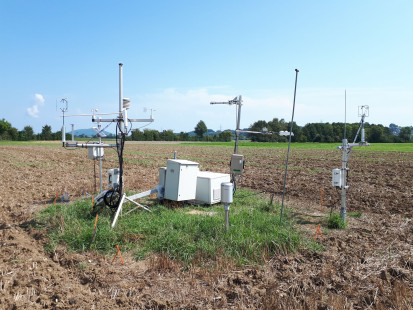
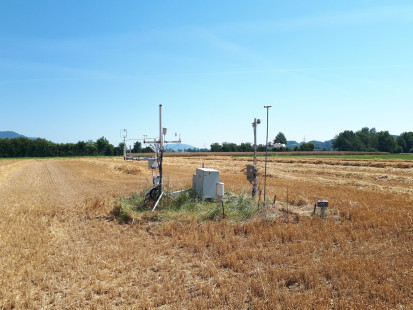
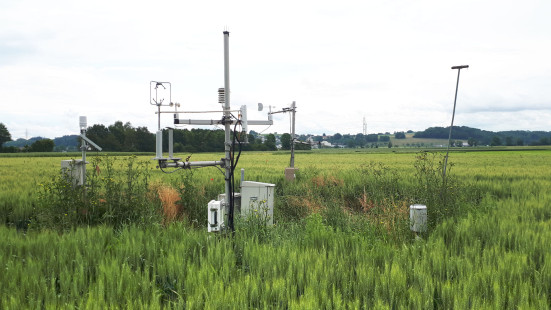
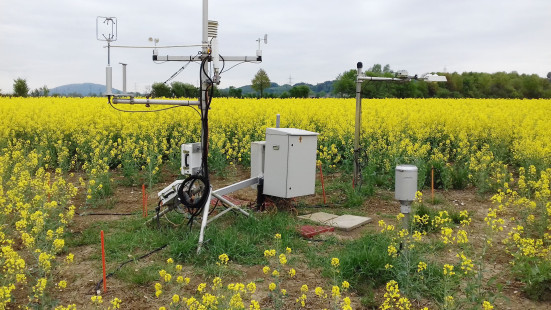
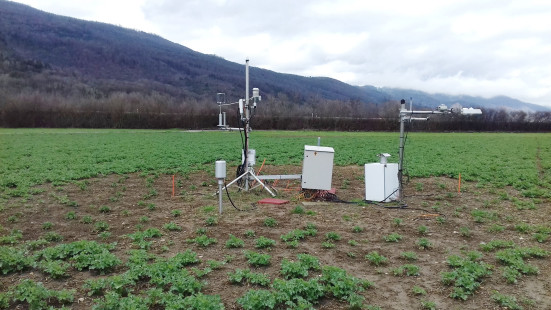
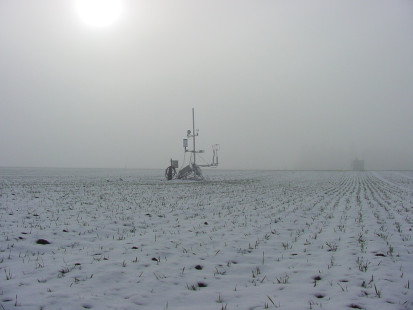
Photos
You are here: CH-OE2, Oensingen
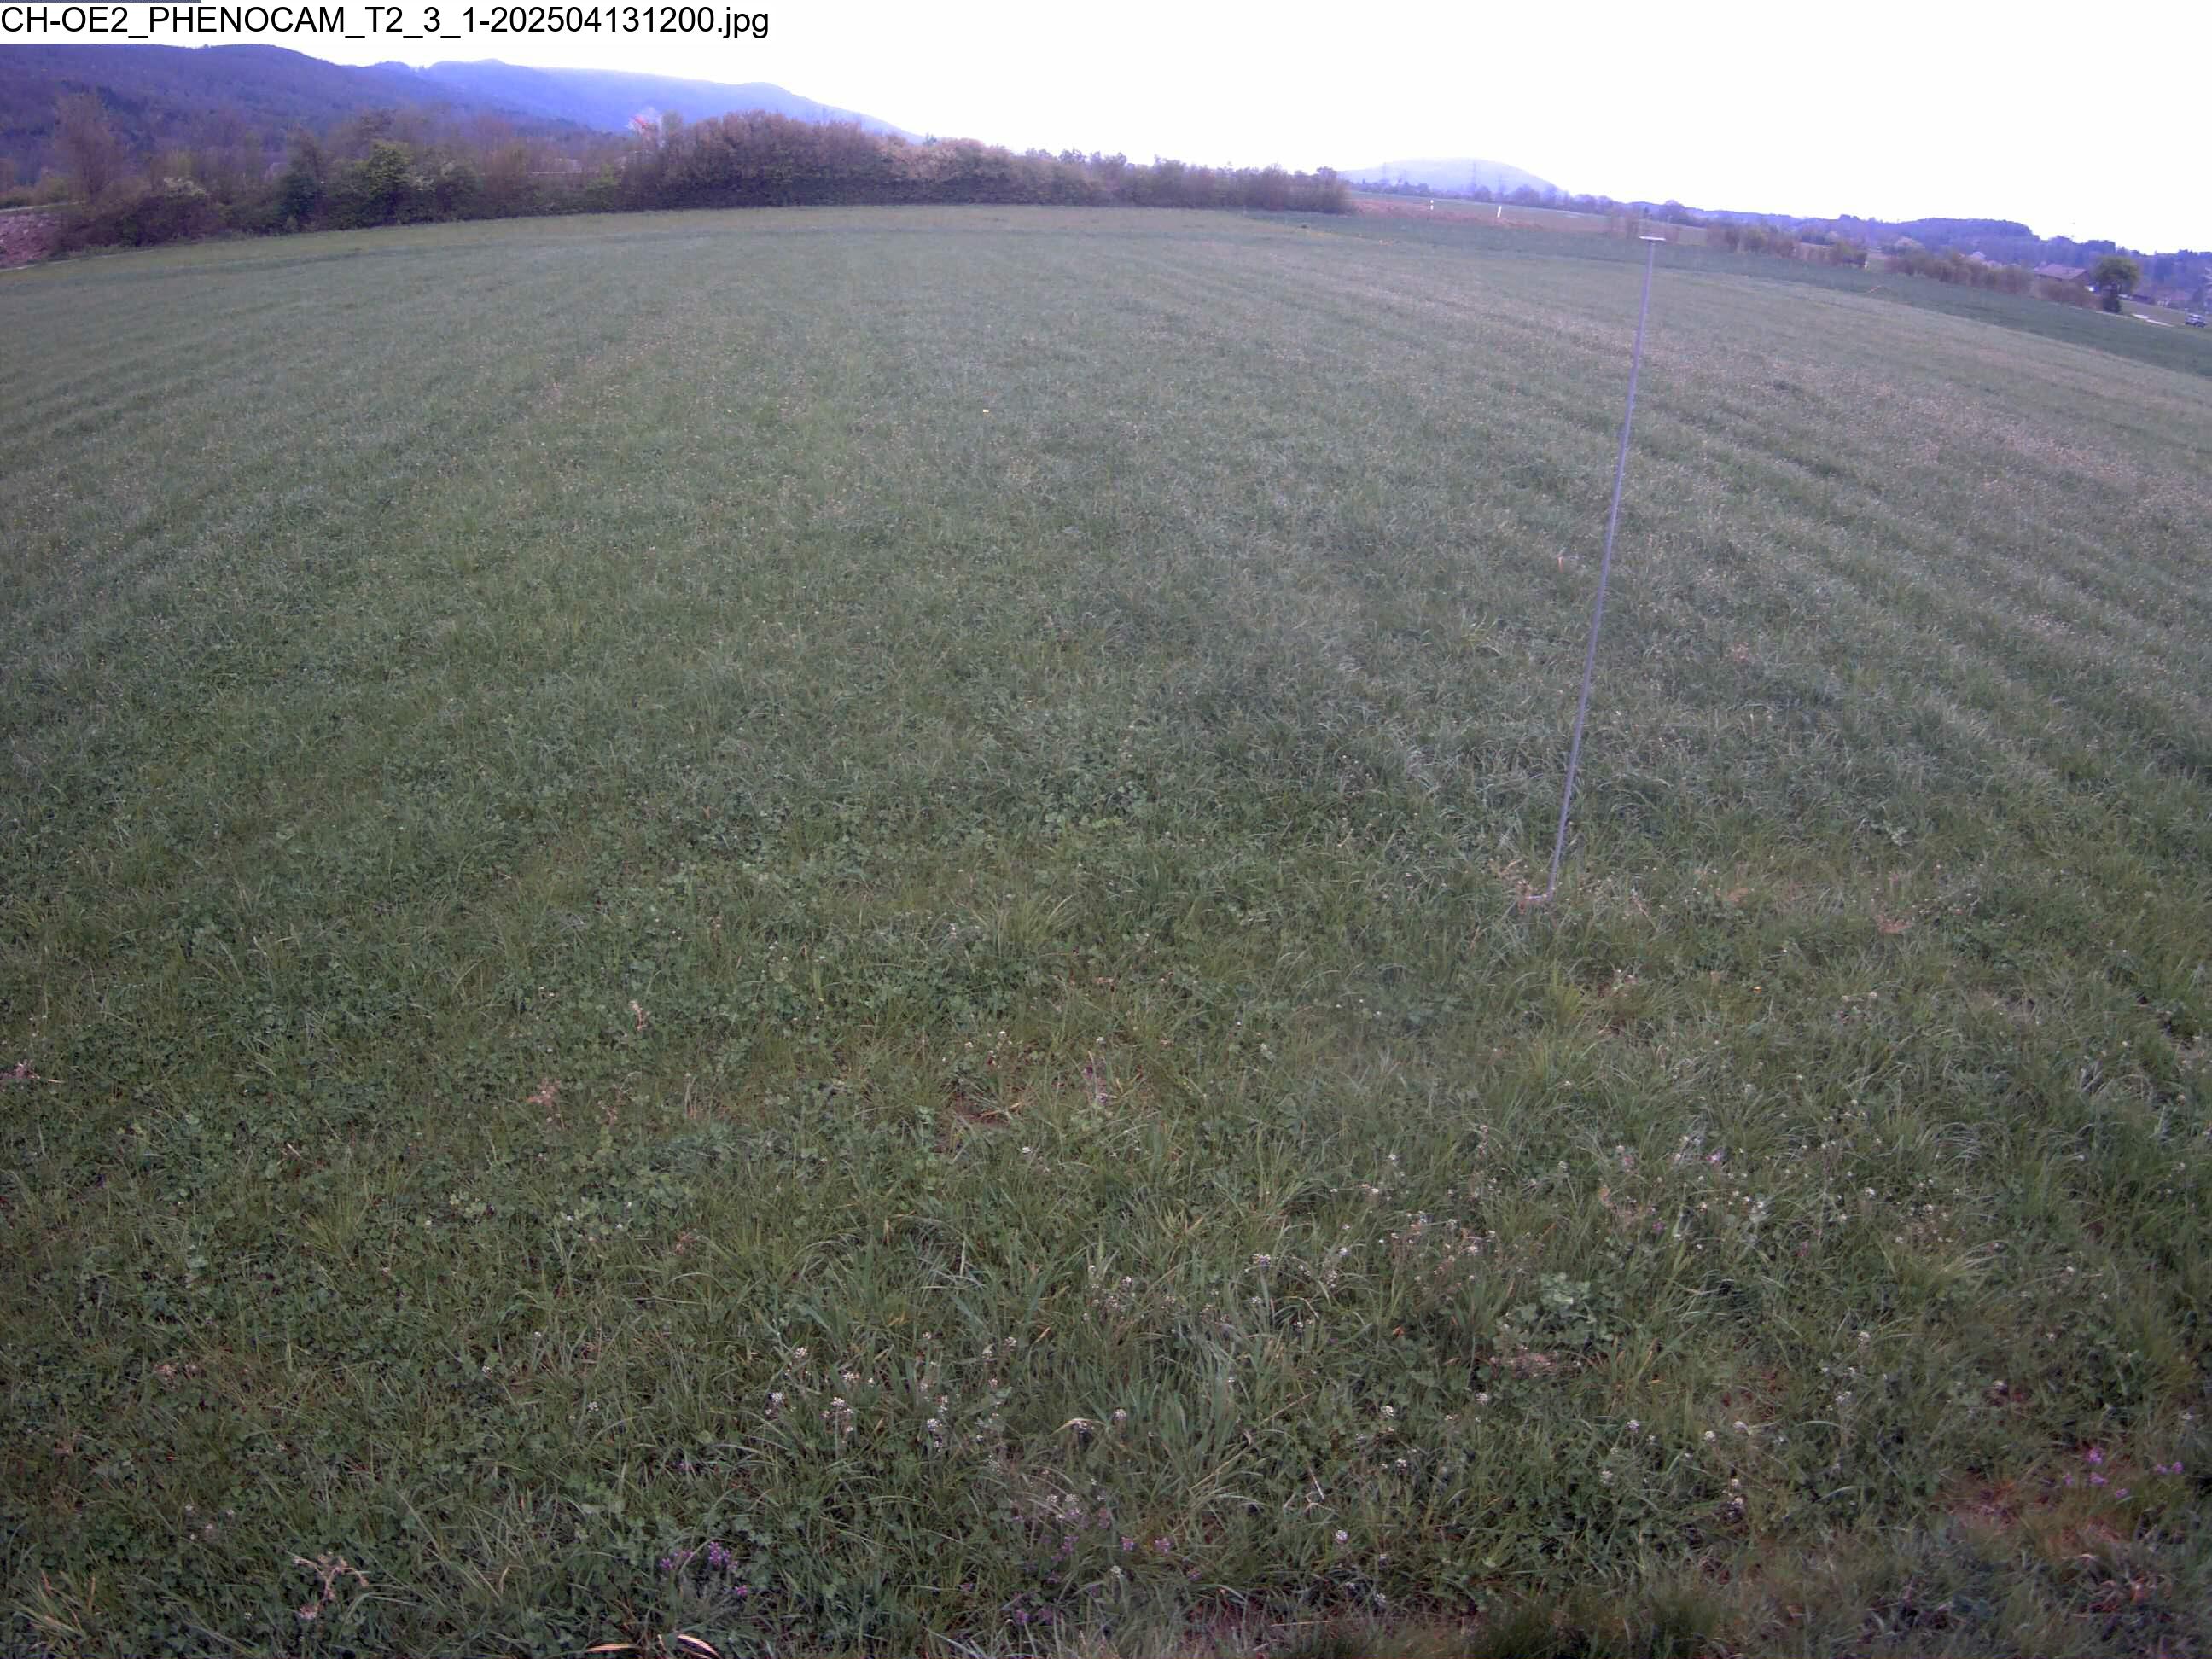
Webcam
- Most recent image from the main tower
Fieldbook
News
CH-OE2: Added results from soil measurements (2020)
Results from soil measurements at site CH-OE2, Oensingen in 2020 are now available. Soil info @ CH-OE2 site description ... Read More
Short Report – QA/QC Meeting 3 Apr 2025
The new Short Report with an overview of recent fluxes and meteo data can be downloaded from here: Short Report - QAQC Meeting 3 Apr 2025 ... Read More
CH-OE2: Added results from LAI measurements (2005-2020)
Results from LAI measurements (2004-2020) at site CH-OE2, Oensingen are now available for download. LAI info @ CH-OE2 site description Direct link to file: CH-OE2_LAI_2004-2020.xlsx ... Read More
Videos
Research Site Oensingen (CH-OE2) 2018
Webcam Time Lapse Videos Since 2005
References
- Alaoui and Goetz (2008) Dye tracer and infiltration experiments to investigate macropore flow
- Ammann et al. (2007) The carbon budget of newly established temperate grassland depends on management intensity
- Ceschia et al. (2010) Management effects on net ecosystem carbon and GHG budgets at European crop sites
- (1) Dietiker et al. (2010) Testing the ability of the DNDC model to predict CO2 and water vapour fluxes of a Swiss cropland site
- Emmel et al. (2018) Integrated management of a Swiss cropland is not sufficient to preserve its soil carbon pool in the long term
- Fritsche et al. (2008) Summertime elemental mercury exchange of temperate grasslands on an ecosystem-scale
- Hastings et al. (2010) Uncertainty propagation in soil greenhouse gas emission models: An experiment using the DNDC model and at the Oensingen cropland site
- Hug et al. (2015) (ZIP) NABObio12_13 Ergebnisse der Pilotphase 2012 und 2013 (German)
- Kutsch et al. (2010) The net biome production of full crop rotations in Europe
- Sus et al. (2010) A linked carbon cycle and crop developmental model: Description and evaluation against measurements of carbon fluxes and carbon stocks at several European agricultural sites
More Info
Last Updated on 4 Apr 2025 17:50