CH-FRU FP2020 (2005-2019)
Contents
Flux Products
- FP2020
Identifier: ID20200929102705
For an explanation of variables in the output file, please see here: ReddyProc Data Output Format
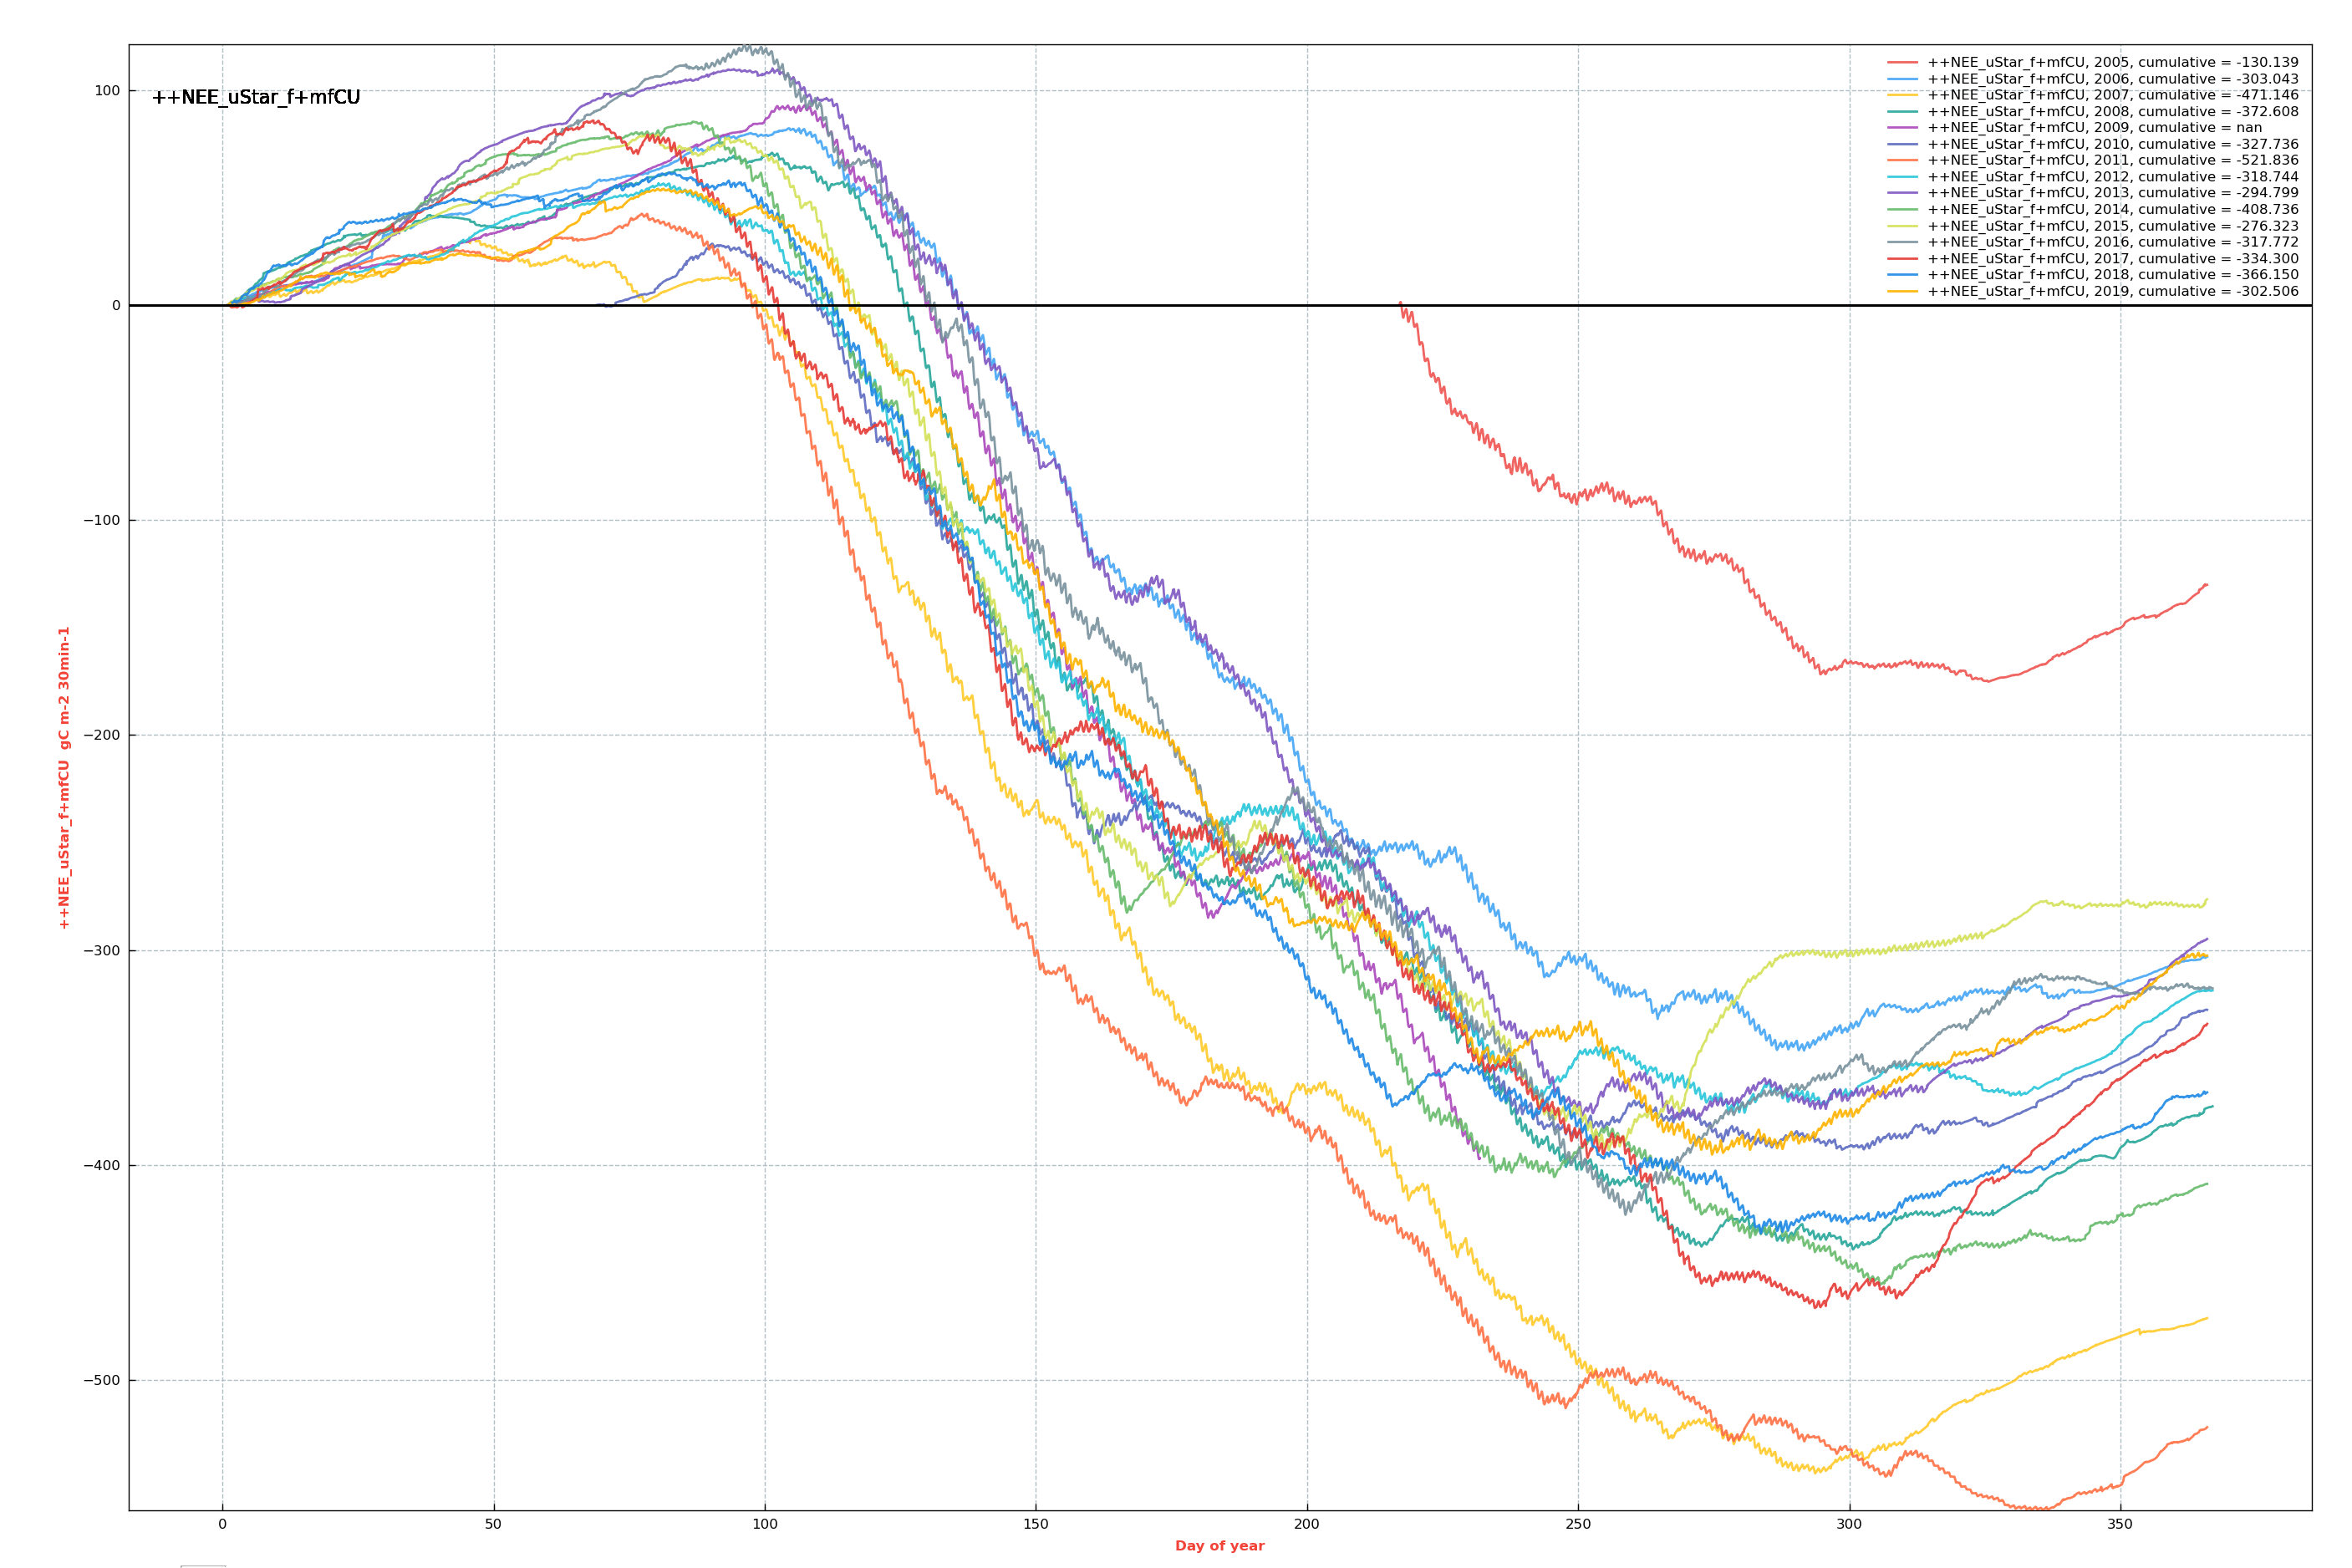
CH-FRU: Cumulative fluxes of NEE 2005-2019 (variable: NEE_ustar_f) in g C m-2 yr-1.
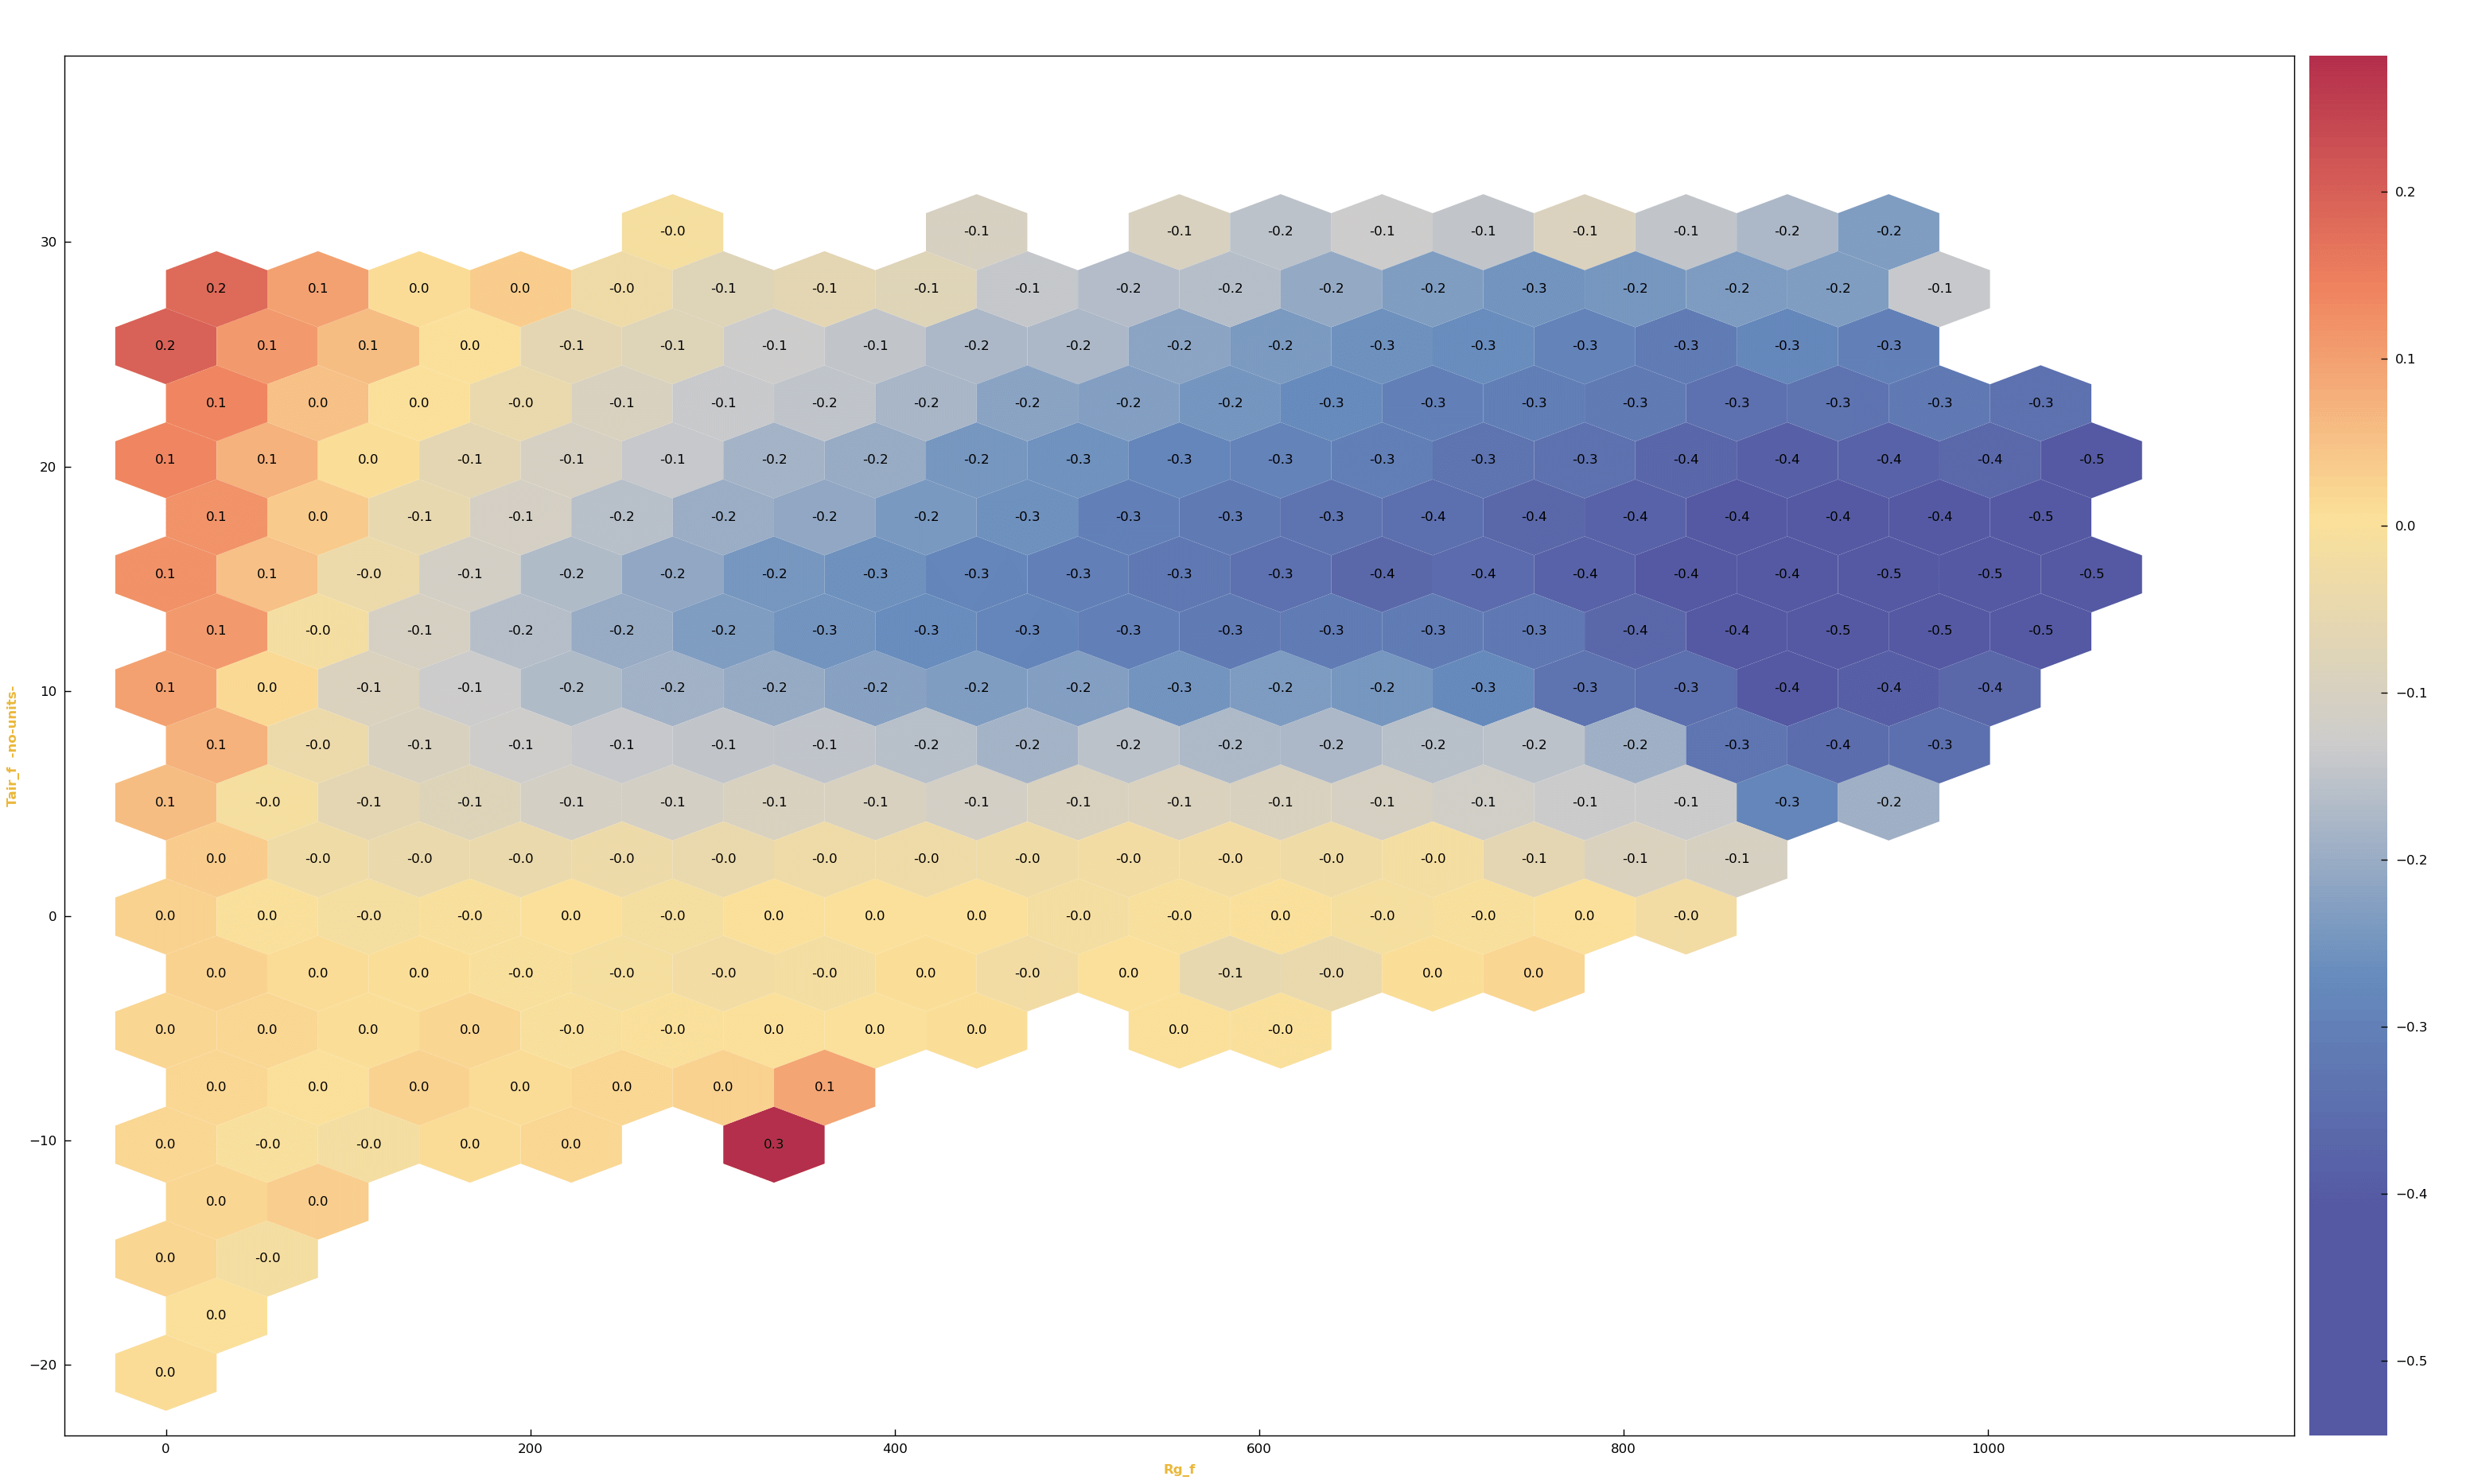
CH-FRU: Mean fluxes of NEE 2005-2019 (variable: NEE_ustar_f) in g C m-2 yr-1, shown in 20×20 classes of short-wave incoming radiation (Rg) and air temperature (TA). The plot was generated from 242874 half-hourly NEE fluxes.
Description
PI flux product (FP) of CH-FRU ecosystem flux and meteo data over 15 years between 2005-2019, calculated for JR master thesis.
Used ustar in this dataset: U50, the median estimate of the ustar threshold (50% quantile of the bootstrapped uncertainty distribution).
Key Stats
- Complete gap-filled years: 13 of 15 (not included are 2009 and 2010 due to large data gap)
- Available measured values:
NEE_ustar_f: 59.6% measured / 40.4% gap-filled (after all quality checks, outlier removal and ustar threshold application) - Available data after gap-filling: 242874 half-hourly fluxes (
NEE_ustar_f) - Range of U50 ustar thresholds: seasonal thresholds ranging between 0.03 m s-1 (2008) and 0.17 m s-1 (2018), mean 0.07 m s-1 (2005-2019)
- Best estimate cumulative carbon uptake (2005-2008, 2011-2019, 13 years): 4.68 kg C m-2 (
NEE_ustar_f), avg. 0.360 kg C m-2 yr-1 - Carbon source / sink behavior: The site is a sink for CO2 in 13 of 13 complete years (
NEE_ustar_f).- Sink: Highest uptake 522 gC m-2 (2011), lowest uptake 276 gC m-2 (2015)
Dataset Production
Info about flux levels can be found here: Flux Levels
Software
EddyProfor flux calculations (links to details of Level-1 fluxes are given below for each year).ReddyProcfor ustar threshold detection, MDS gap-filliing and partitioning.Rfor other processing steps, e.g. merging
Setup
2005-2019: R350-IRGA75
USED FLUX VERSIONS
- 2005 R350-IRGA75_FF-201606 / Level-1_ID2016-06-30T213909
- 2006 R350-IRGA75_FF-201606 / Level-1_ID2016-06-30T213921
- 2007 R350-IRGA75_FF-201606 / Level-1_ID2016-06-30T213928
- 2008 R350-IRGA75_FF-201606 / Level-1_ID2016-06-30T213932
- 2009 R350-IRGA75_FF-201606 / Level-1_ID2016-06-30T213938
- 2010 R350-IRGA75_FF-201606 / Level-1_ID2016-06-30T213944
- 2011 R350-IRGA75_FF-201606 / Level-1_ID2016-06-30T213950
- 2012 R350-IRGA75_FF-201606 / Level-1_ID2016-07-02T110901
- 2013 R350-IRGA75_FF-201606 / Level-1_ID2016-07-02T110910
- 2014 R350-IRGA75_FF-201606 / Level-1_ID2016-07-02T110920
- 2015 R350-IRGA75_FF-201606 / Level-1_ID2016-07-02T110929
- 2016 R350-IRGA75_FF-201902 / Level-1_ID2019-03-03T030144
- 2017 R350-IRGA75_FF-201902 / Level-1_ID2019-03-03T030355
- 2018 R350-IRGA75_FF-202005 / Level-1_ID2020-05-29T103526
- 2019 R350-IRGA75_FF-202005 / Level-1_ID2020-05-31T135334
Known Issues
- –
References
- –
Last Updated on 5 Oct 2024 13:15