CH-FRU / FF-202005
Flux calculations for years 2018 (updated), 2019 (new) and 2020 so far (new).
- Fluxes 2018 were re-calculated because of the Wrong Calibration Gas 2017.
- Fluxes 2020 include data so far, until incl. 12 May 2020.
Contents
Level-1 Fluxes
- Python script for conversion to CSV and flux calculations: FCT v0.9.5
- With this FCT version, the calibration gas issue can be corrected during the conversion of the EC raw data files from binary to CSV, before they are used in flux calculations.
- EddyPro version: 7.0.6 (18 Dec 2019)
- For an overview of raw data formats see here.
Calibration Gas Issue
See here for more details on this issue.
The calibration gas used to calibrate IRGA CO2 measurements during the time periods 2018_1 and 2019_1 was wrong and the CO2 measurements needed to be corrected before flux calculations. This correction cannot be done in EddyPro directly. High-res CO2 raw data of these time periods were multiplied by a factor of 0.974 during the conversion from the raw binary format to the CSV format.
(I first corrected for this issue using the same approach as described here for CH-AWS and using a separate Python script, but then I found an easier solution by directly applying the gain during the conversion to CSV.)
Workflow
- All raw binary files were first converted to CSV format.
- 2019_2 and 2020_1 were not affected by the calibration gas issue and were directly converted into CSV, using the appropriate FRMT file.
- 2018_1 and 2019_1 were affected by the calibration gas issue and needed correction. The gain of 0.974 was applied to the two CO2 columns (CO2 in ppm and mmol) during their conversion from binary to CSV. This means that the CSV file format of these corrected files is the same (i.e. same columns and same order of columns) as for the other time periods.
- Fluxes were then calculated for the complete year from the CSV files.
- Regarding 2019: Since 2019_1 (corrected for calibration gas issue) and 2019_2 CSV files had the same columns, all converted CSVs were pooled to calculate fluxes for the complete year 2019.
Open Lag Runs
The lag time between SA and IRGA was checked 2018 – 2020 in relatively large time windows. This was done by searching the max covariance without using a default lag time in EddyPro, i.e. all found lag times in the EddyPro full_output file show found lag times. The peak of the distribution of all found lag times per year were:
- 2018 – 2020: peak @0.25s for CO2, @0.25s for H2O, final lag search window 0-10s
Histogram of found lag times
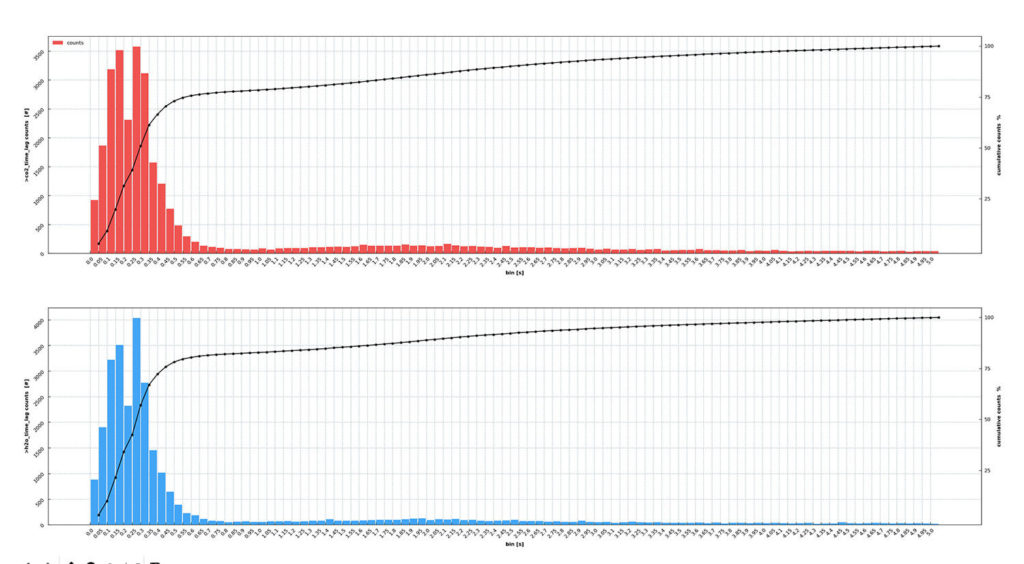
CH-FRU found lag times 2018-2020
Daily median of found lag times
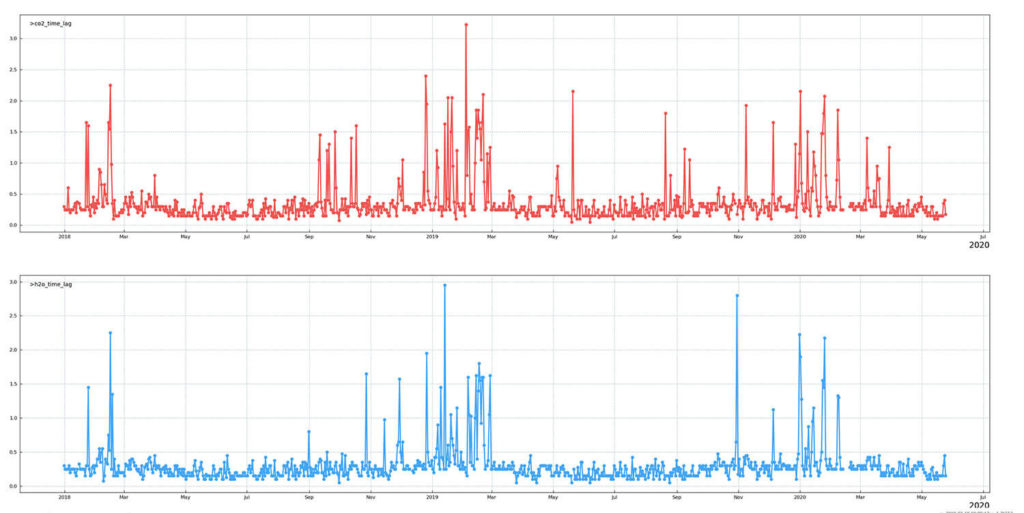
CH-FRU found lag times 2018-2020
Spectral Correction
The spectral correction worked without any errors in both years 2018 and 2019. For the correction of the so far available fluxes 2020 the spectral assessment file from the 2019 run was used (without errors, worked).
Off-season Carbon Uptake Correction (Burba Correction)
No correction was applied, since the true correction factor is currently unknown. The implementation of this correction in EddyPro most likely over-corrects CH-FRU fluxes and was since not applied during flux calculations.
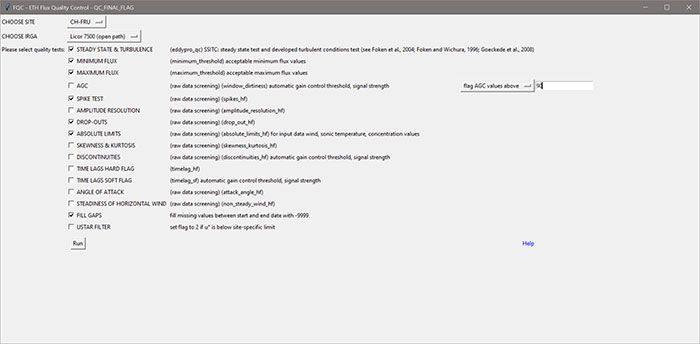
Level-2 Fluxes
- Quality control with Python script FQC v2.1.0.
- AGC QC was not used since our logging system stops recording data if weather gets too bad (i.e. bad signal).
- QC settings are shown here:
Last Updated on 18 Feb 2024 22:11